Session 6: Hands-on activity #3
Housekeeping
🎯 Learning Objectives
By the end of this session, you will be able to:
- Compute simple lexical diversity measures using spreadsheet software
- Compute advanced lexical diversity measures using TAALED
- Explain how modern lexical diversity measures are calculated
- Calculate simple lexical sophistication measures using dedicated web application
- Describe how lexical sophistication measures behave on a single input text.
- Discuss benefits and drawbacks of lexical richness measures.
Recap
Terminology
In this presentation, I will use the following terms:
- Input text: The text you want to analyze (e.g., learner produce text).
Lexical Diversity (LD)
- Lexical Diversity is computed internally to text.
- e.g., Type-Token Ratio:
- Count the number of unique word (Type) in the input text
- Count the number of total word (Token) in the input text
- Devide Type by token.
Relationships between CTTR and Year
- Durrant (2023) introduced:
- \(CTTR = {nType \over \sqrt{2 * nToken}}\)
new slide
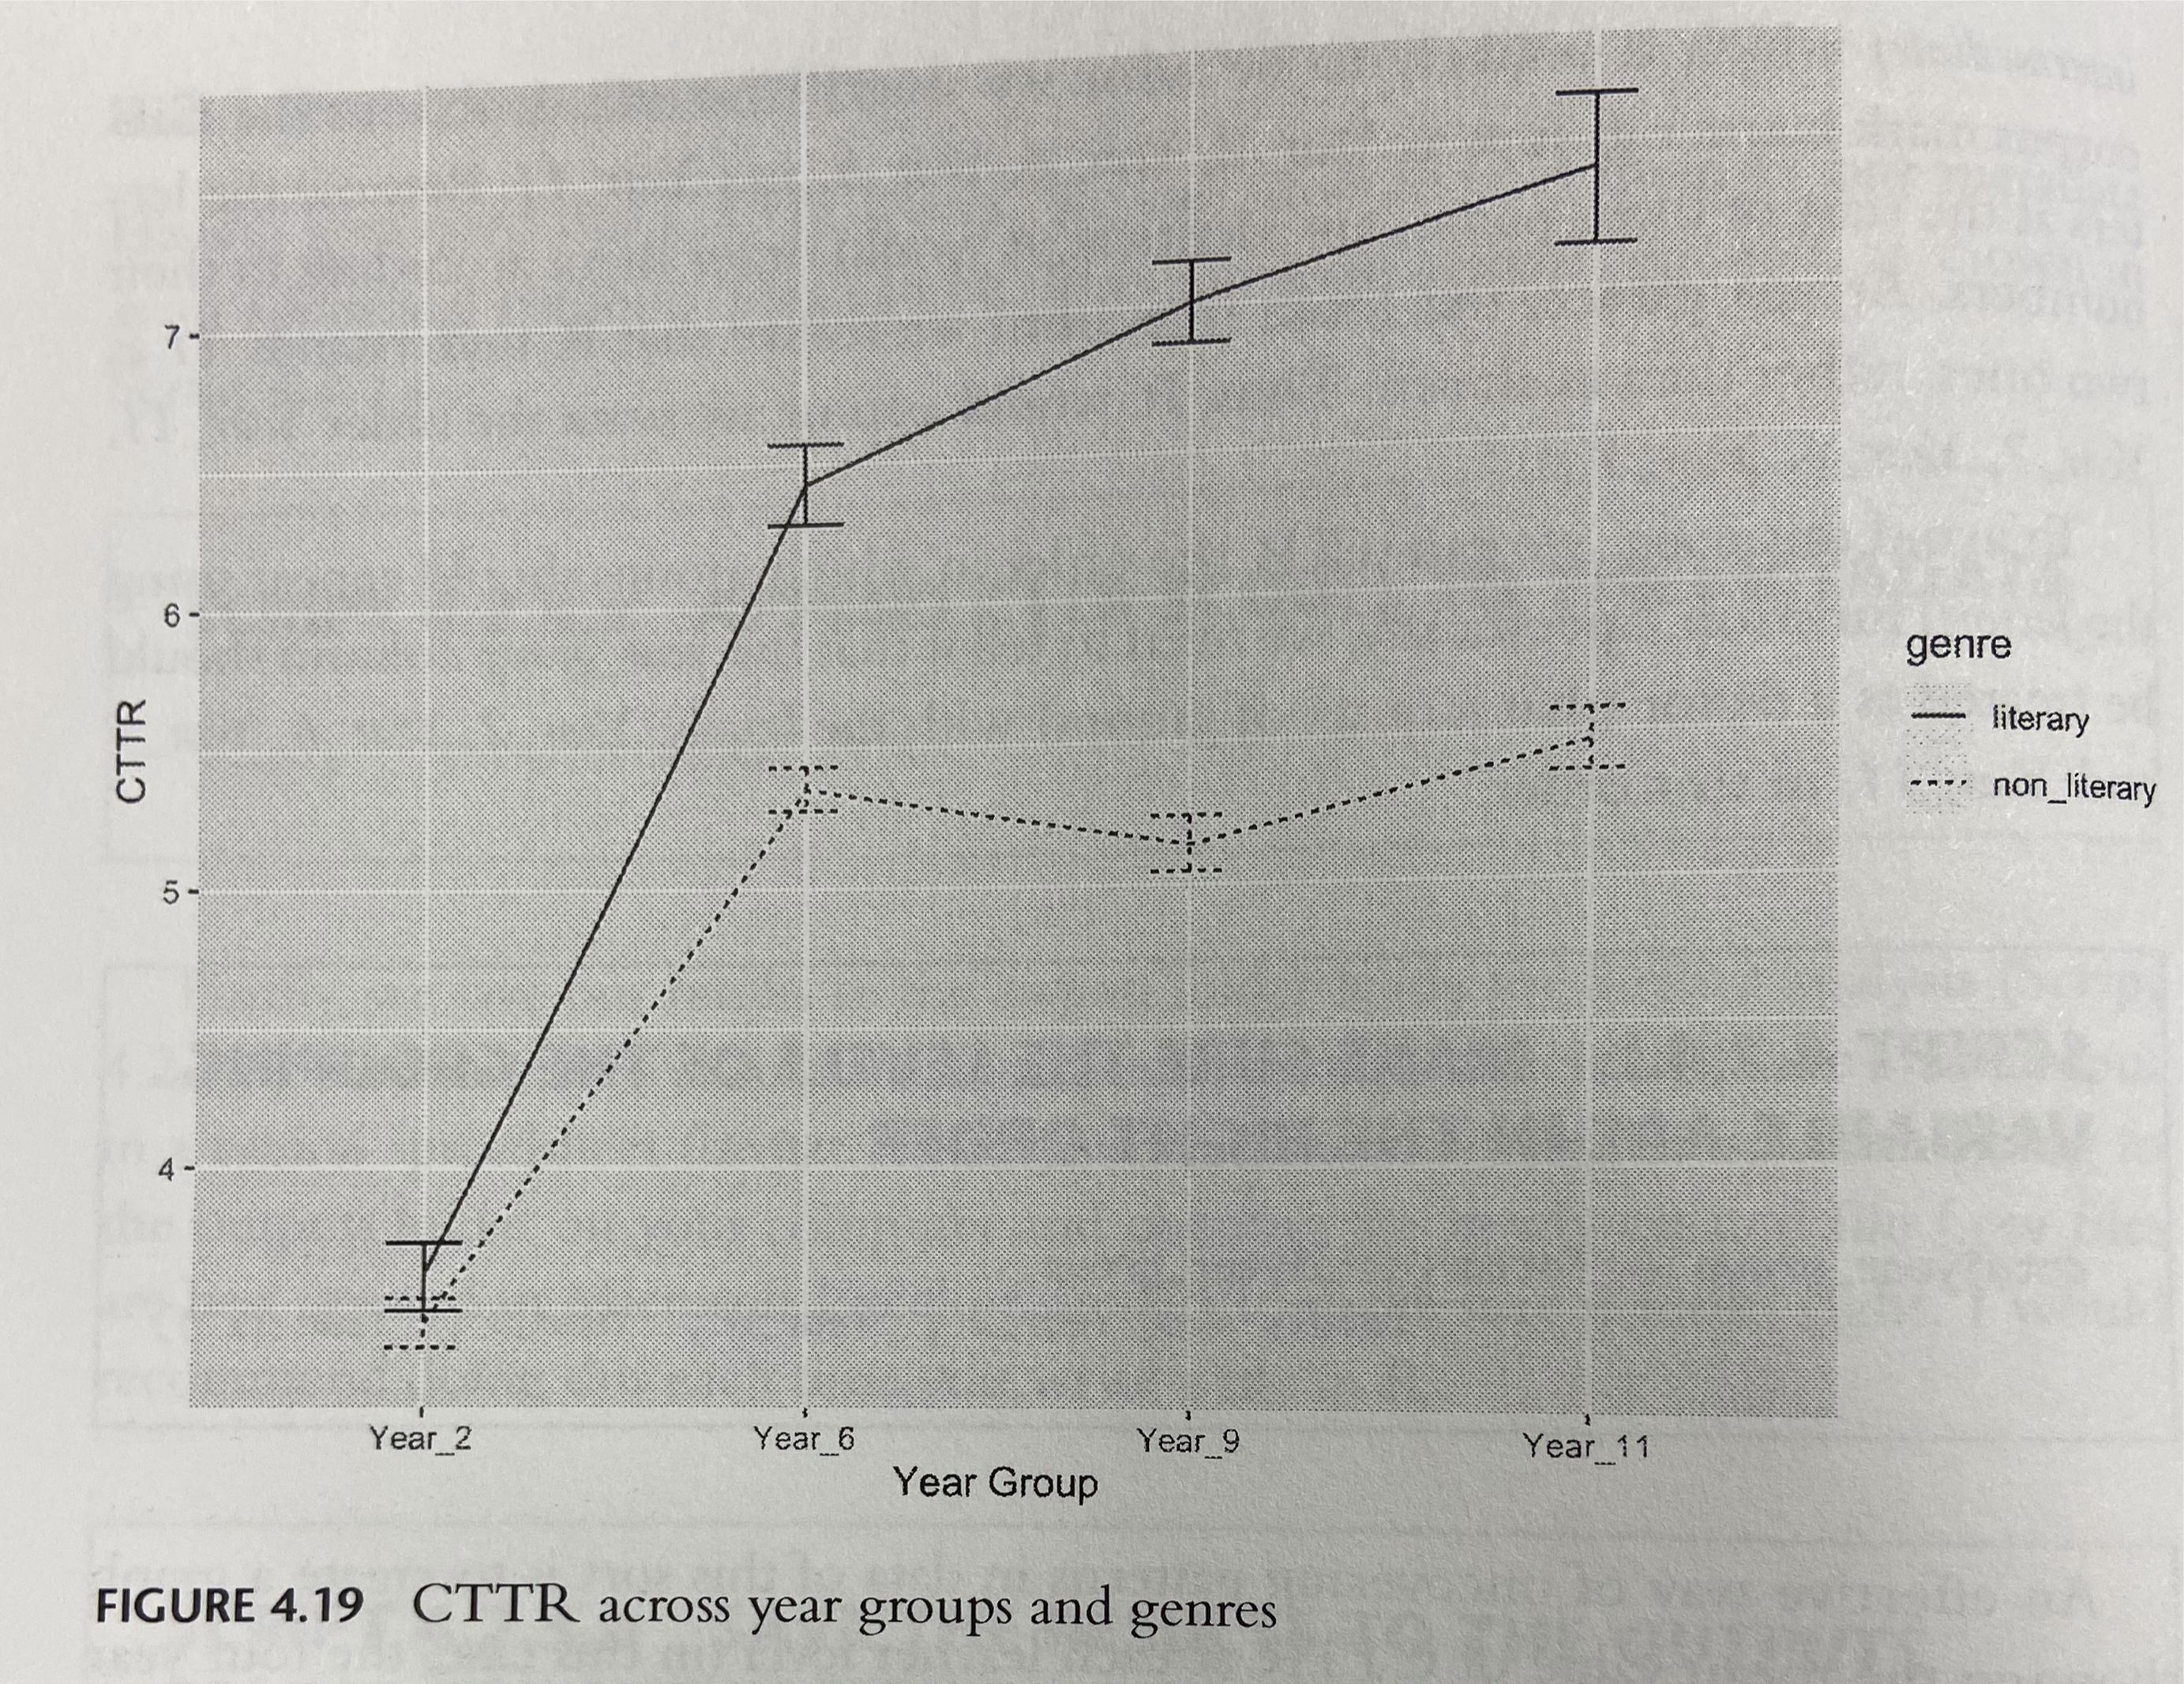
Figure 4.19
Lexical diversity
- Learner’s proficiency has positive relations with lexical diversity
- Other features such as genres can also mediate the relationships
Lexical sophistication (LS)
- Lexical Sophistication requires external resources to compute.
- e.g., Corpus frequency lists, SemD score, etc.
- To derive an LS index:
- Compile a reference word list
- For each word in the input text, retrieve
index scorefrom the reference list - Average the scores (out of item awarded the score)
Corpus Lab 2: Task 2
Instruction for Task 2
- Your task is to replicate Durrant’s Figure 4.19 with two different indices – MTLD and MATTR.
Figure 4.19
Computing simple Lexical Diversity measures by hand
Simple Text Example
Cound the type and token of the following texts.
| ID | Text |
|---|---|
| Text 1 | “The dog ran. The dog jumped. The dog played. The dog barked. The dog ran again and jumped again.” |
| Text 2 | “A curious fox trotted briskly through the meadow, leaping over mossy logs, sniffing wildflowers, and vanishing into golden twilight.” |
Note : Texts were generated by GPT for illustration purposes.
Simple Text Example
| ID | Text | Token | Type |
|---|---|---|---|
| Text 1 | “The dog ran. The dog jumped. The dog played. The dog barked. The dog ran again and jumped again.” | 19 | 8 |
| Text 2 | “A curious fox trotted briskly through the meadow, leaping over mossy logs, sniffing wildflowers, and vanishing into golden twilight.” | 19 | 19 |
Note : Texts were generated by GPT for illustration purposes.
Impact of Text lengths
| ID | Text | Token | Type |
|---|---|---|---|
| Text 1a | “The dog ran. The dog jumped. The dog played. The dog barked. The dog ran again and jumped again.” | 19 | 8 |
| Text 1b | “The dog ran. The dog jumped. The dog barked. The dog played. The dog ran quickly. The dog jumped so high. The dog barked very loudly. The dog played, sat, and rolled. The dog sneezed. The dog ate the food.” | 40 | 18 |
| Text 1c | “The parrot squawked loudly. The parrot chirped again. A toucan perched nearby. The parrot fluttered. Wings flapped softly. The parrot chirped again. Feathers shimmered under sunlight. The crow cawed. The parrot glided low. The air shimmered. The owl blinked slowly. The parrot perched again. The owl blinked slowly. The parrot shrieked. The parrot chirped nearby again. The parrot squawked again.” | 60 | 27 |
Note : Texts were generated by GPT for illustration purposes.
Let’s calculate some classical Lexical Diversity indices
Open Google Spreadsheet for lexical-diversity-hand-calculation
Copy the spreadsheet to your Drive before working on it.
Calculate the lexical diversity indices on the next page.
Speadsheet looks like this
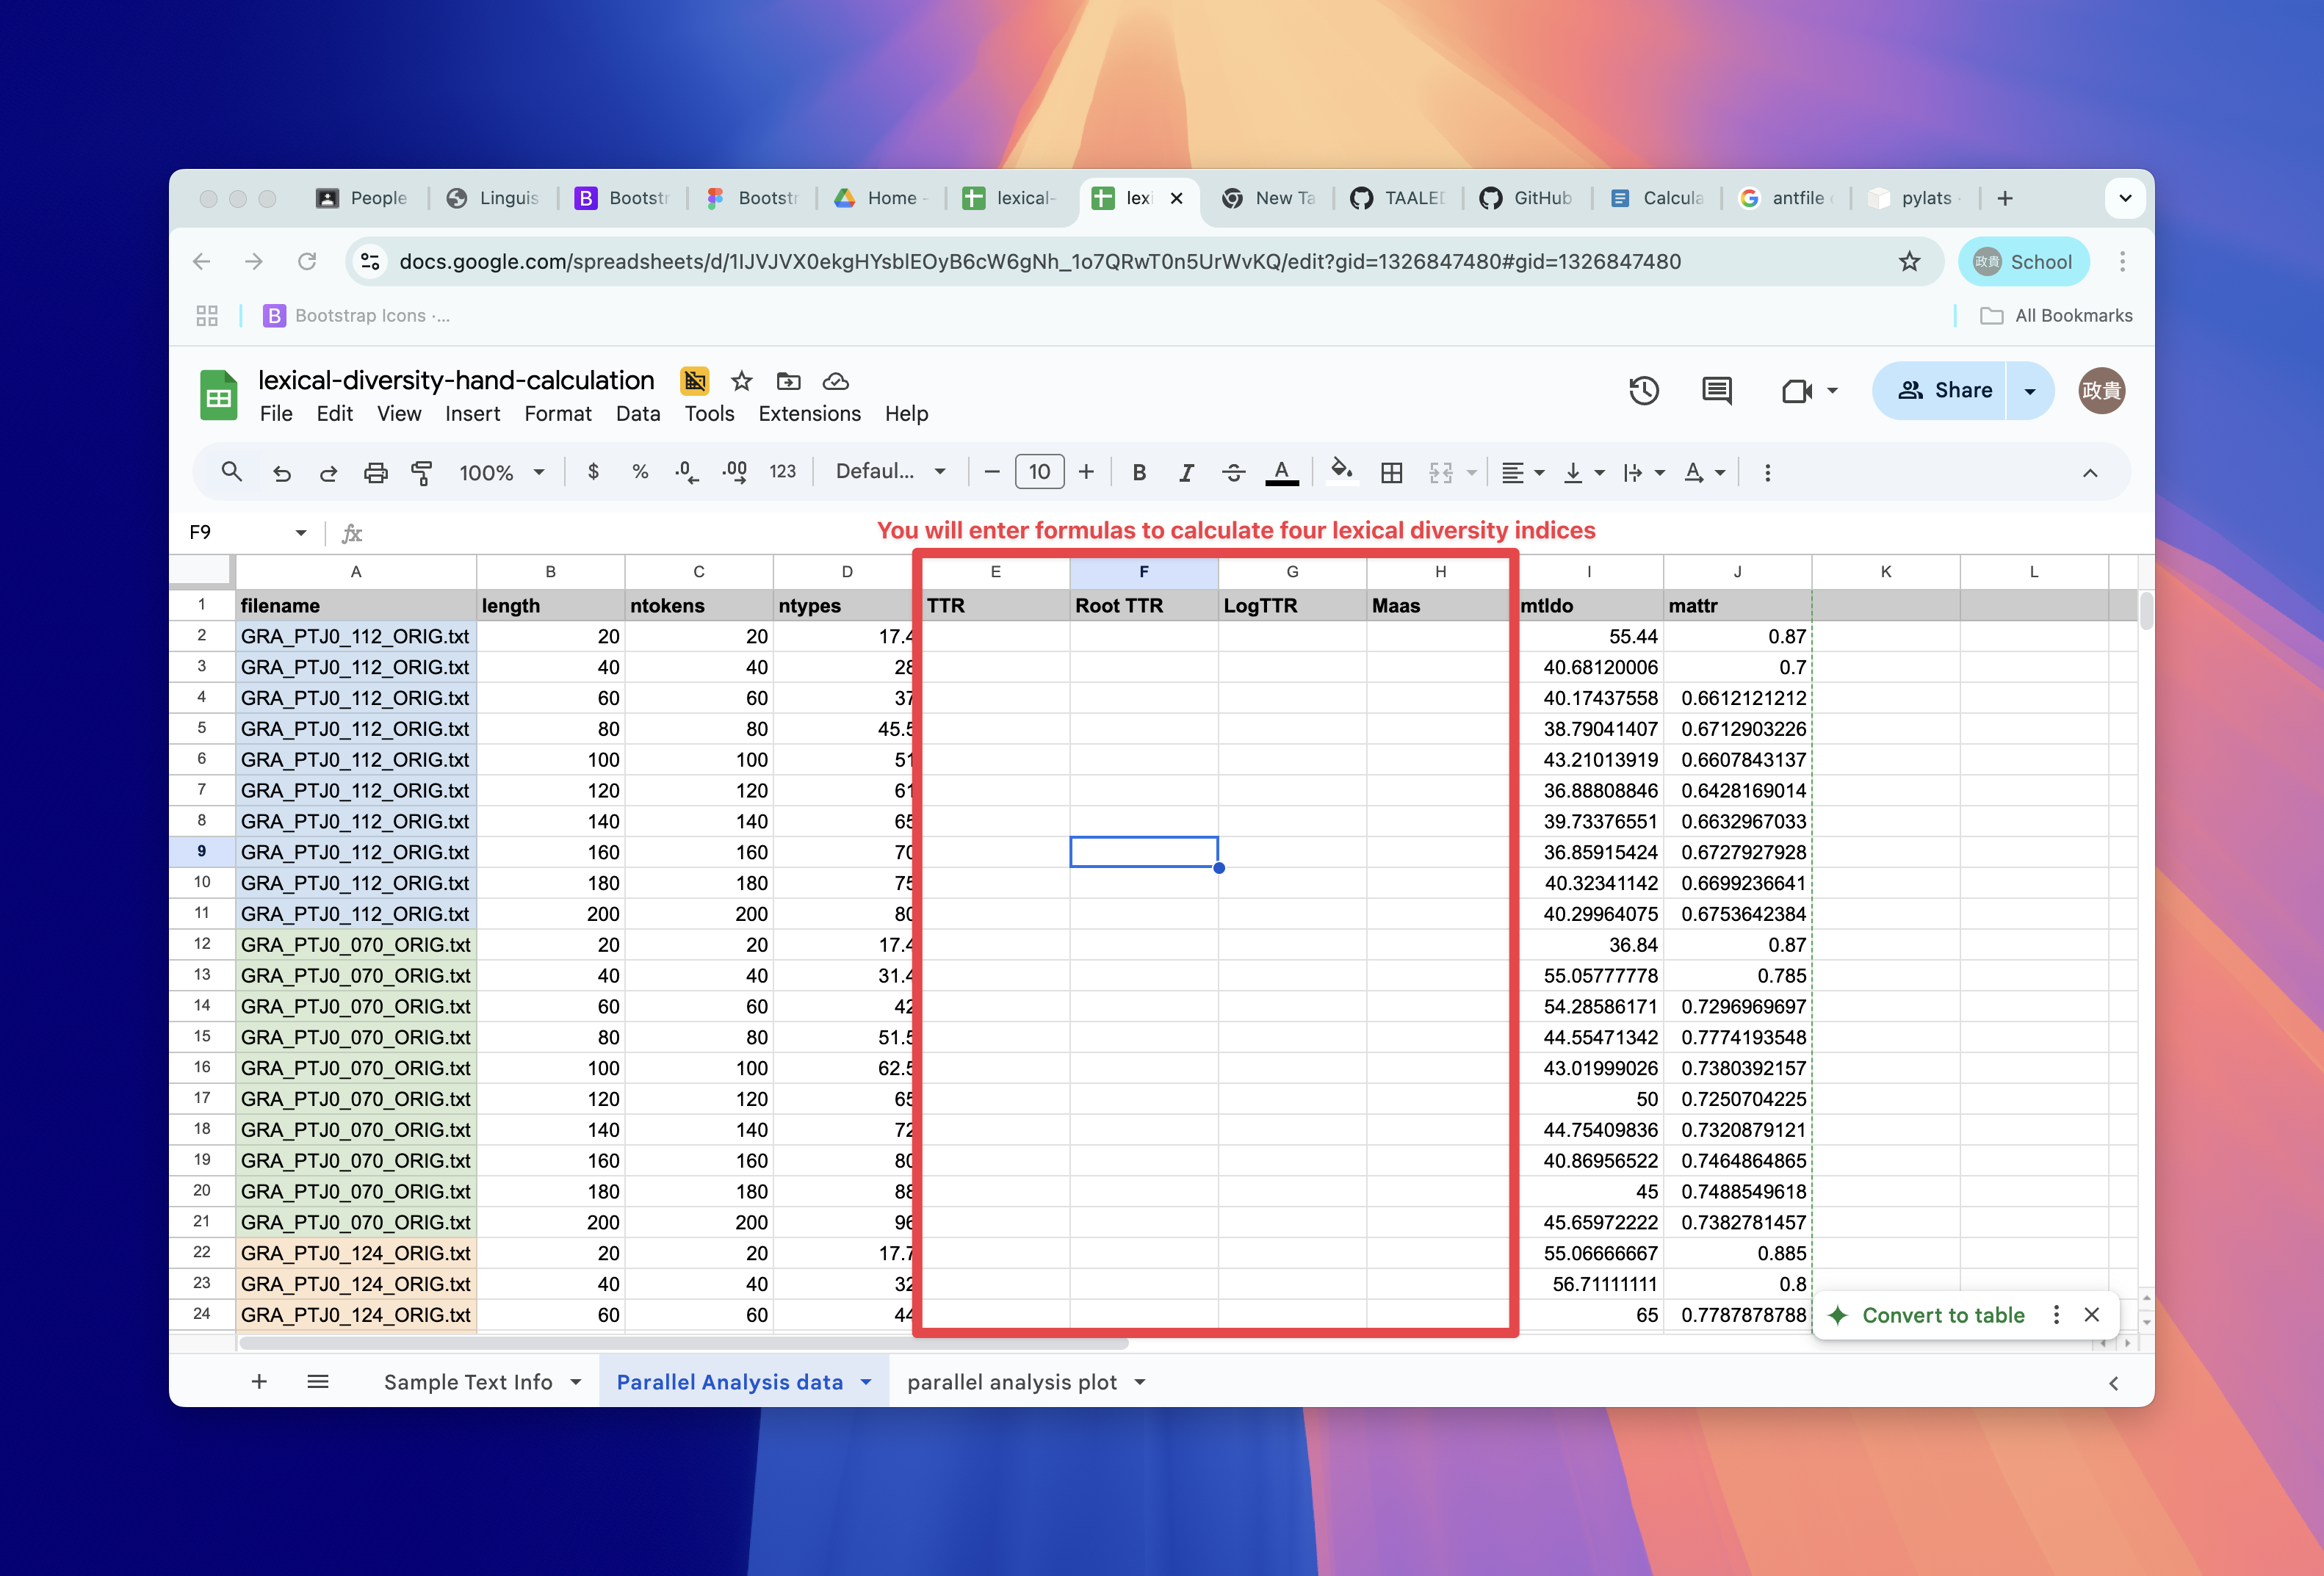
Google Spreadsheet
These are real example from ICNALE
Parallel Analysis
- Through this worksheet, we will look at how Kyle et al. showcased the impact of text lengths on lexical sophistication indices.
- Parallel analysis is a technique to investigate the impact of text length
- Chunking texts into smaller lengths (20, 40, 60 etc.)
- Calculate index for each sliding window with same lengths
- Average them into a single value
- because the original texts are the same, the values should NOT change due to different text lengths.
Some classic lexical diversity
We calculate this for illustration but NEVER use these in your study.
\(TTR = {nType \over nToken}\)
\(RootTTR = {nType \over \sqrt{nToken}}\)
\(LogTTR = {\log(nType) \over \log(nToken)}\)
\(Maas = {\log(nTokens) - \log(nTypes) \over \log(nToken)^2}\)
Summary
- Through worksheet example of parallel analysis, we demonstrated that the old indices of LD is flawed.
What should we actually use then?
- The Measure of Textual Lexical Diversity (MTLD)
- Moving-Average Type Token Ratio (MATTR)
→ These are shown as more robust indices of LD.
Operationalization of MTLD and MATTR
In pair, recall how MTLD and MATTR is operationalized.
Calculating modern LD indices with TAALED
Using TAALED desktop version
- We can use Tool for the Automatic Analysis of Lexical Diversity (TAALED)
- Download it to your computer and we will use it to compute modern LD measures

TAALED
Setting up
Click the software icon after download
For mac users, the system will issue warning, you must follow the following step:
- Go to
settingand selectPrivacy & Security - If you have already attempted to open the software, there will be
Open Anywaybutton. - Click
Open Anywayand that will allow Mac to open the software.
- Go to
Selecting indices
You can then wait for the TAALED app to start up.
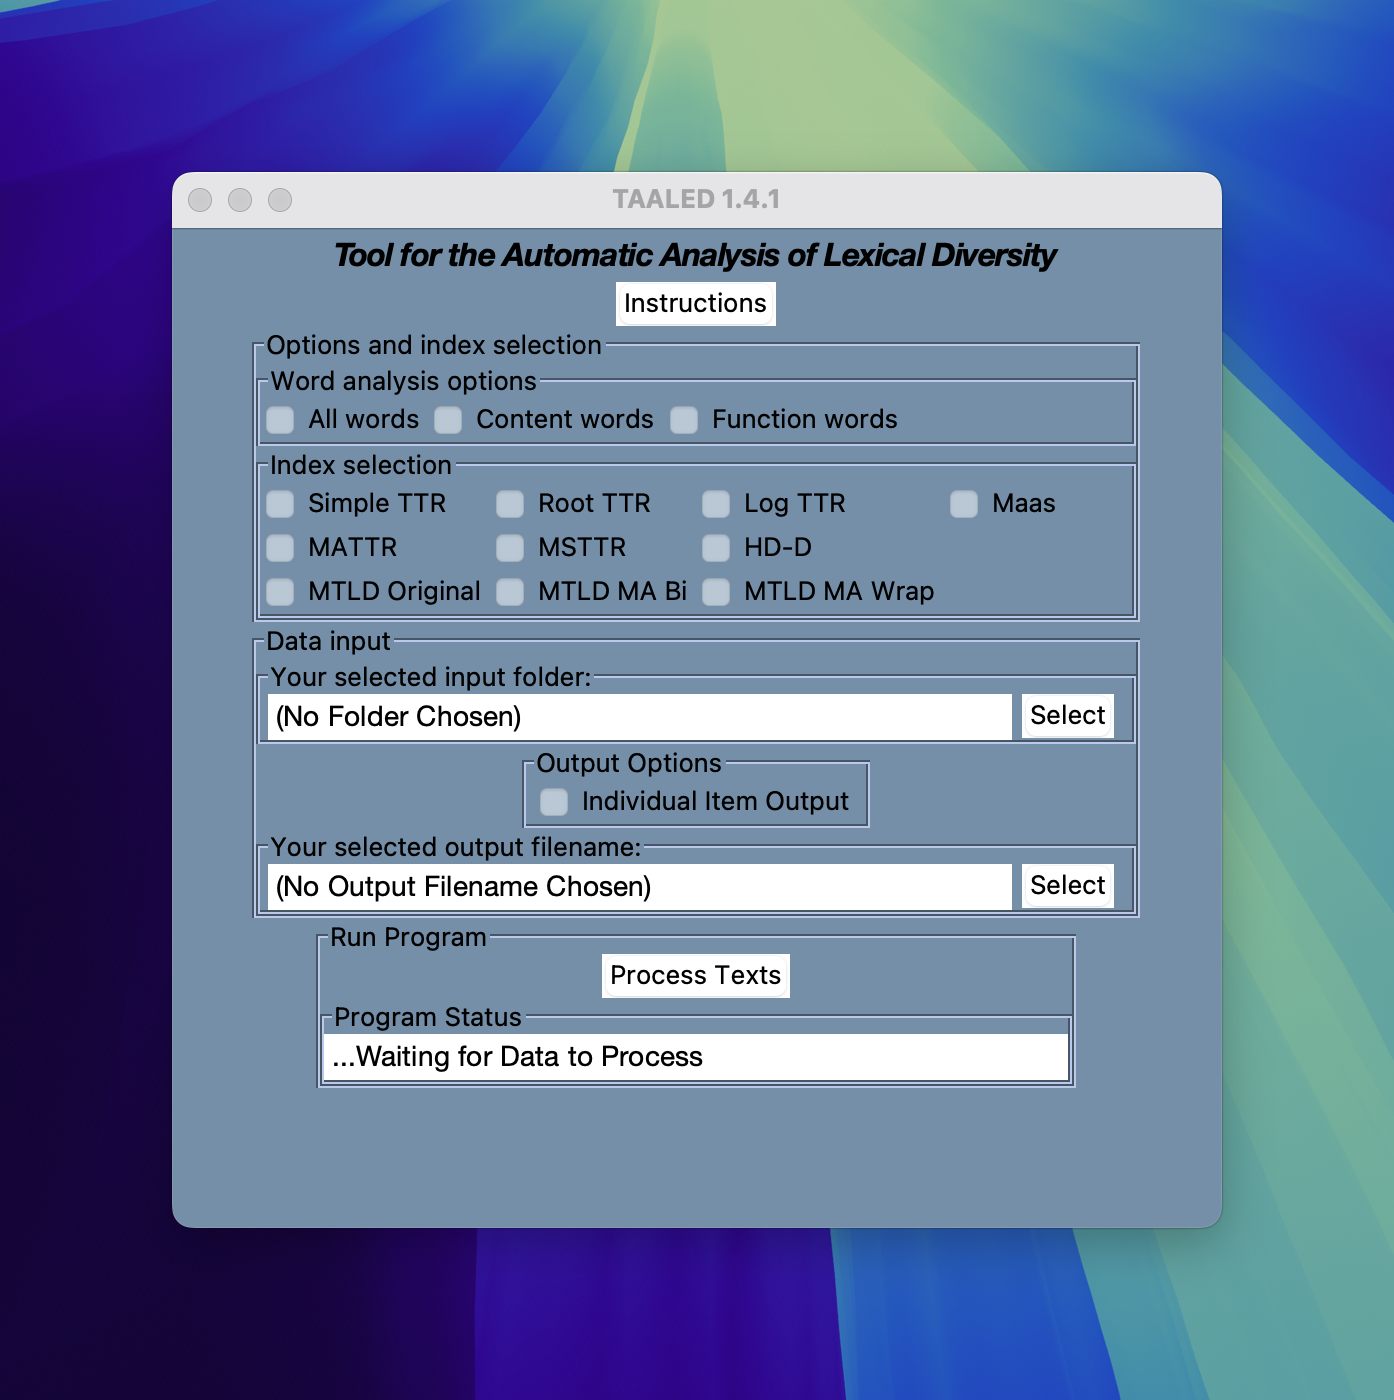
TAALED
Options
Word analysis options
- All words: Conduct analysis including all words.
- Content words: Conduct analysis with content words only.
- Function words: Conduct analysis with function words only.
Options
Index selection
Select the indices you need in the results. Three variants of MTLD are available.
- MTLD Original:
- MTLD MA Bi: Moving Average Bidirectional
- MTLD MA Wrap: If there is words left in the final
factor, come back to the first part and complete the analysis.
Options
Input and output options
- You can choose the input folder by selection
Output option
- Ticking the
Individual Item Outputbutton allows you to have POS analysis
Run the analysis
- Press
Process Textsand wait the following display.
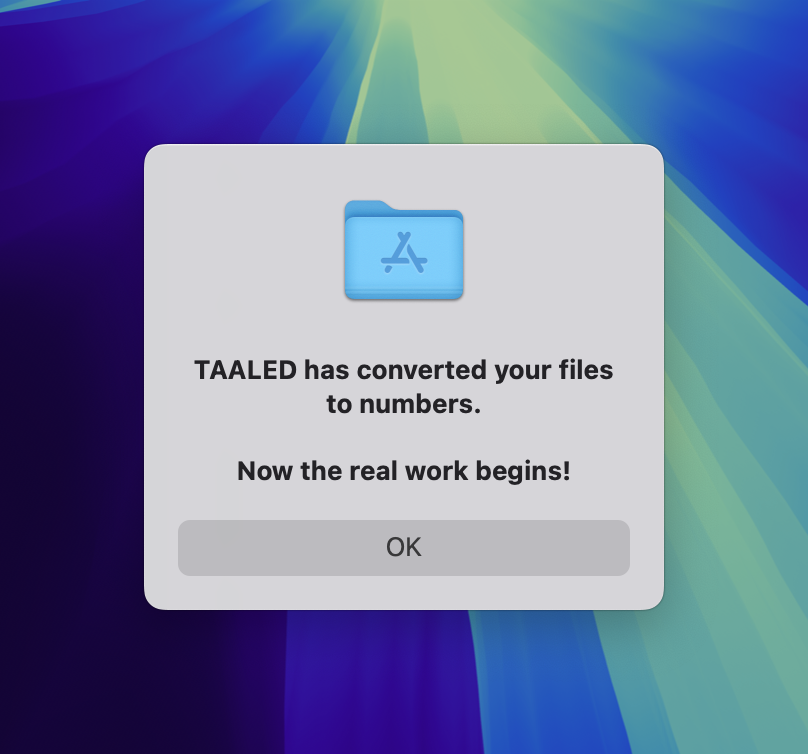
Analysis complete
Let’s take a look at the csv file
- What’s CSV?
- CSV (Comma Separated Values) file is a file extension like others (txt, docx).
- It allows table like representation of data (like excel) separated by comma.
The Raw data (if you open it with text editor) should look like the following:
filename,basic_ntokens,basic_ntypes,basic_ncontent_tokens,basic_ncontent_types,basic_nfunction_tokens,basic_nfunction_types,lexical_density_types,lexical_density_tokens,maas_ttr_aw,mattr50_aw,hdd42_aw,mtld_original_aw,mtld_ma_bi_aw,mtld_ma_wrap_aw
W_CHN_PTJ0_004_B1_2_ORIG.txt,267,124,135,75,132,49,0.6048387096774194,0.5056179775280899,0.056571333957257205,0.7793577981651377,0.7981161136859327,68.68659119235562,65.84622666144406,61.50561797752809
W_JPN_SMK0_015_B1_2_ORIG.txt,302,138,129,82,173,56,0.5942028985507246,0.4271523178807947,0.05530143602594381,0.777865612648221,0.7974803670481457,68.38677597714803,67.6645170484911,65.22185430463576
Opening csv file in a spreadsheet software
- You can open csv file in Excel (or any other spreadsheet software)
Plotting the GiG corpus
The goal of the Corpus Lab, Task 2, is to replicate analysis on GiG.
You will need to have access to both metadata file.
The corpus data is here.
GiG meta data
- GiG metadata documents the necessary data to use for plotting
- Year Group (X-axis in Figure 4.19)
- Genre (grouping variable in Figure 4.19)
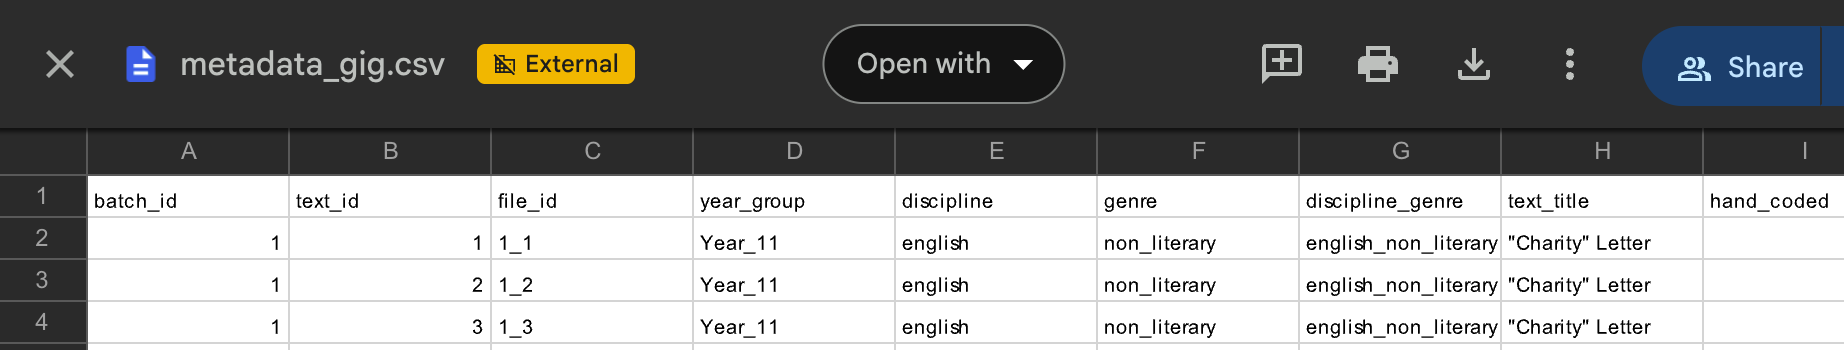
GiG Metadata
Using Corpus Data Visualizer for plotting
See in-class demonstration.
Writing up research question, hypothesis, and results
- Research question?
- Hypothesis: Write your own.
- Results: Write your own.
Success Criteria
Your submission …
Questions?
Computing simple Lexical Sophisitcation measures
Lexical sophistication
There are a number of lexical sophistication measures for English (+ 300).
- 12 categories of measures (Eguchi & Kyle, 2020)
- Frequency
- Range
- Psycholinguistic Norm
- Hypernymy
- N-gram Frequency/Range/SOA
- etc.
Typical operationalization
Typically, lexical sophistication (LS) is calculated as an average:
Typical LS score = \[Total \; LS \; score \over nToken \; with \; LS \; score\]
Average is just a convenient choice.
Using an emulation of TAALES
- Since the desktop version of TAALES is unstable these days, we will use a simple web application.
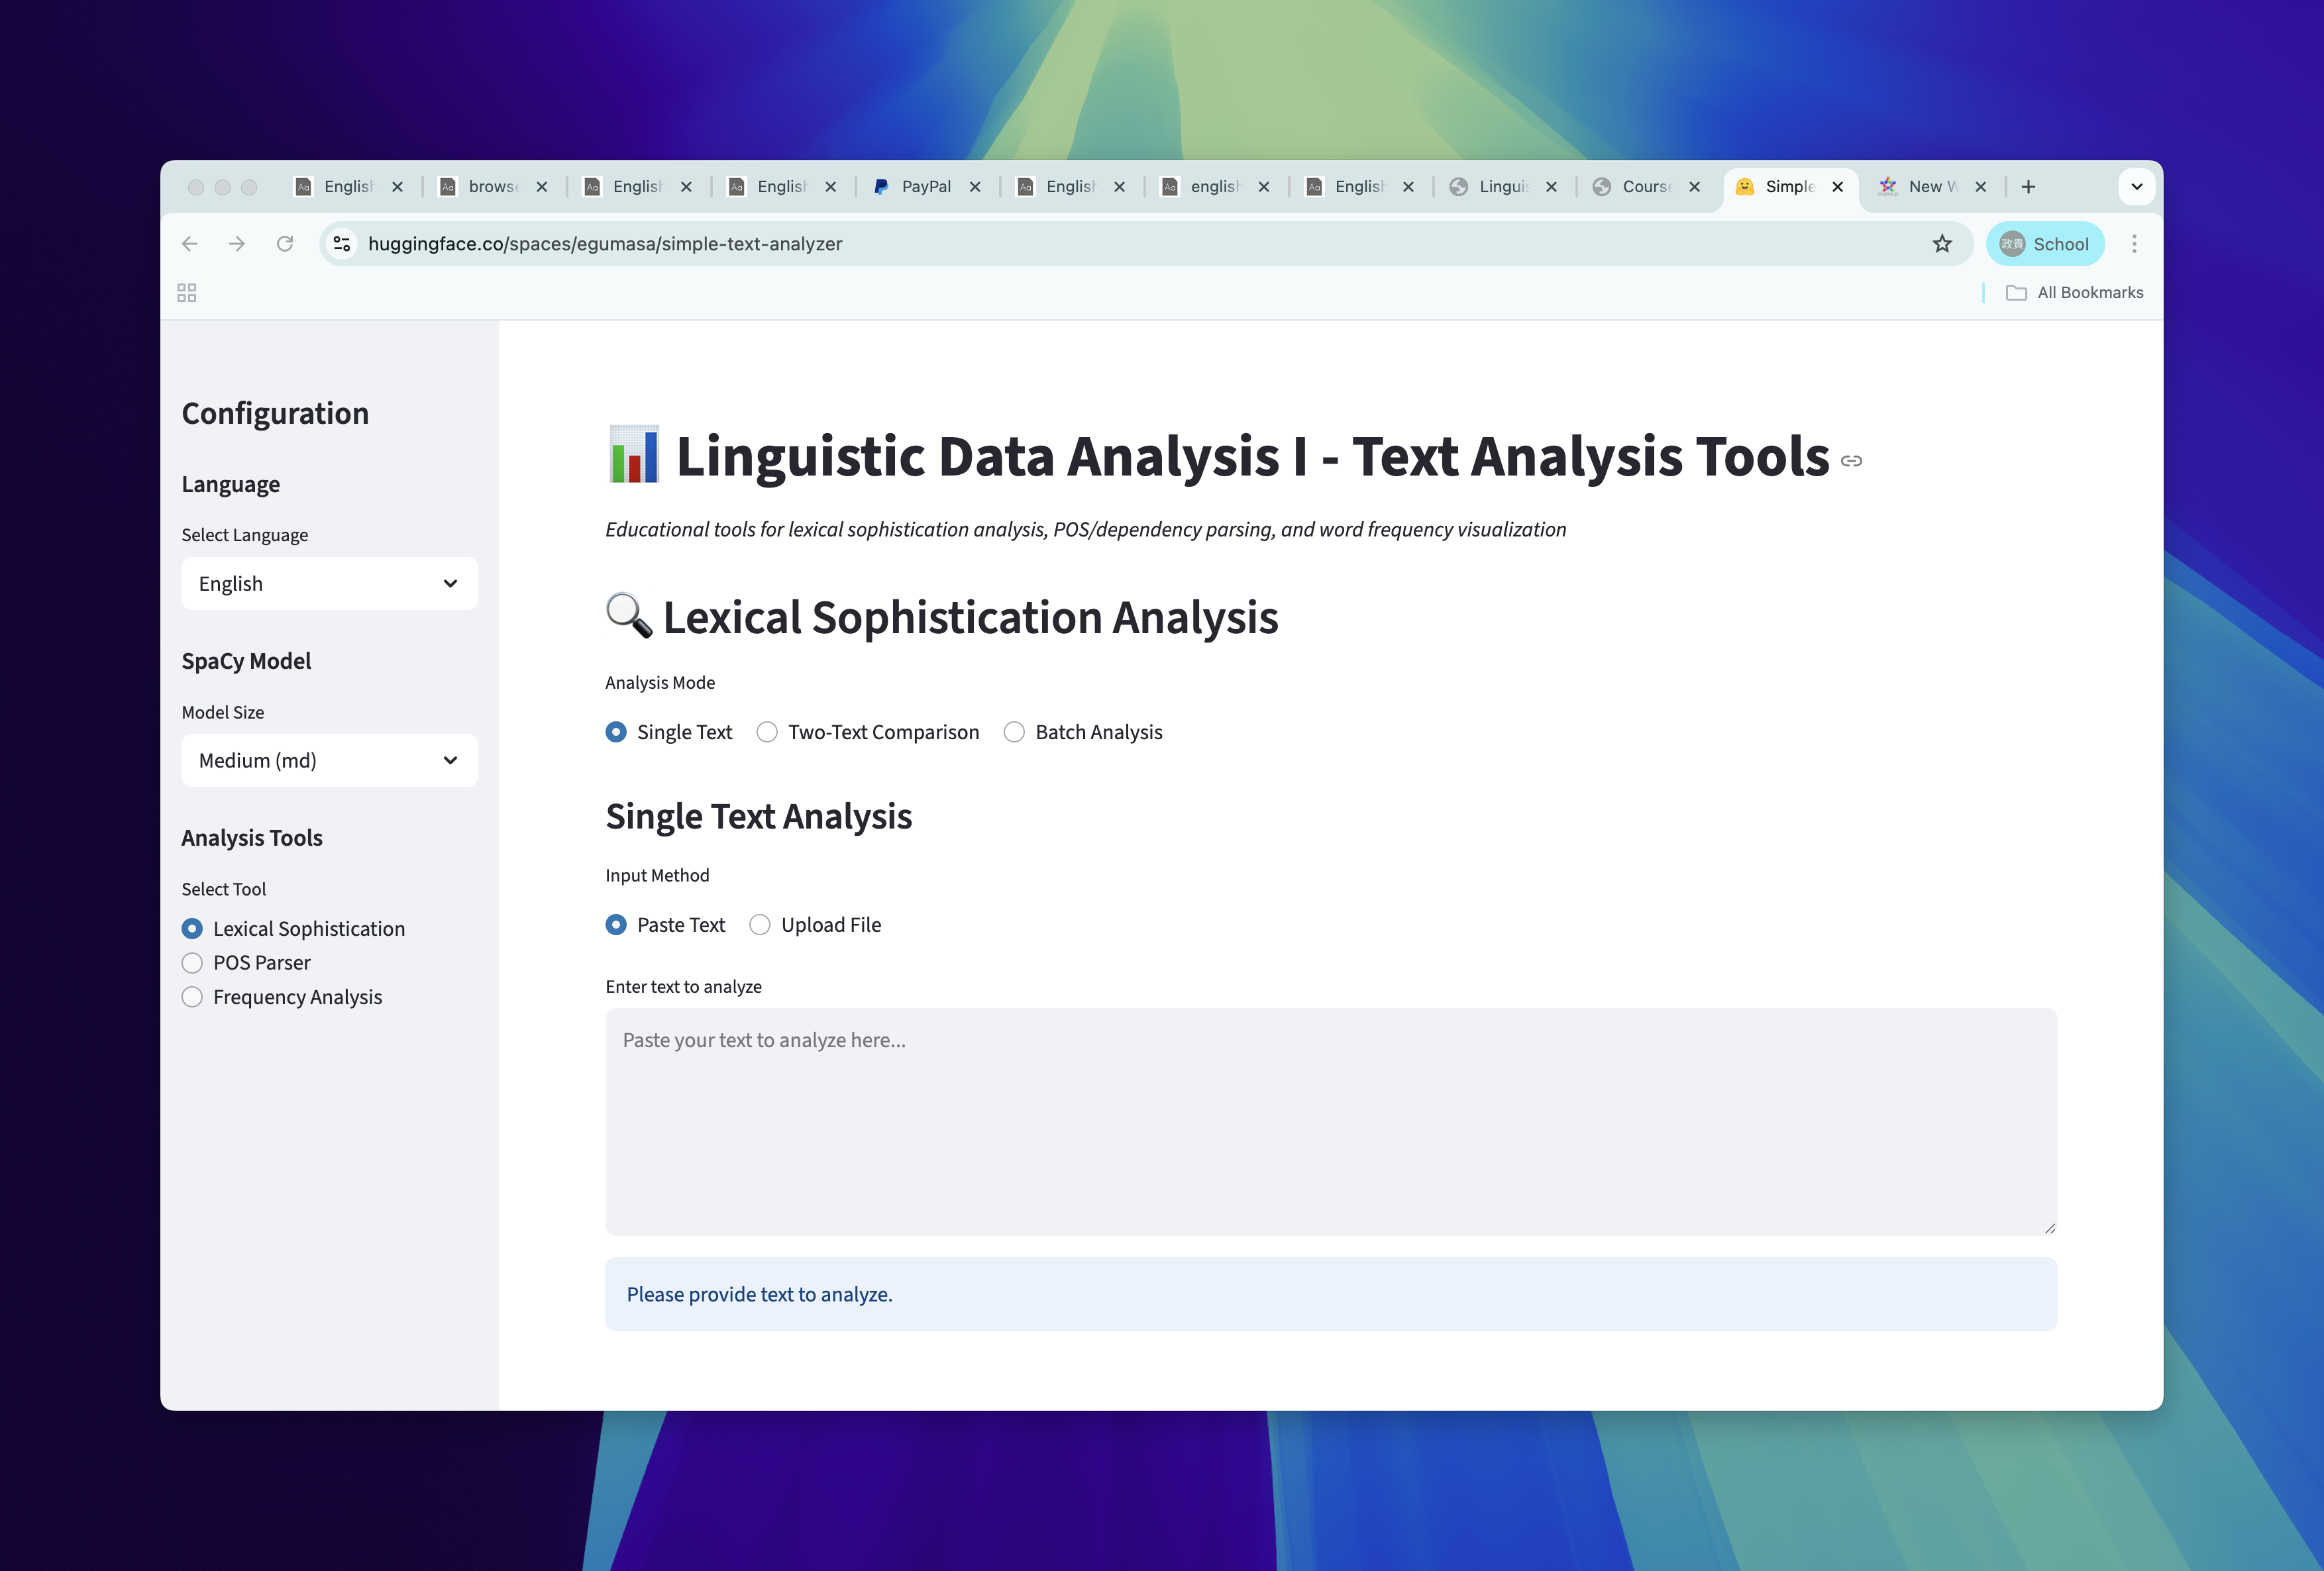
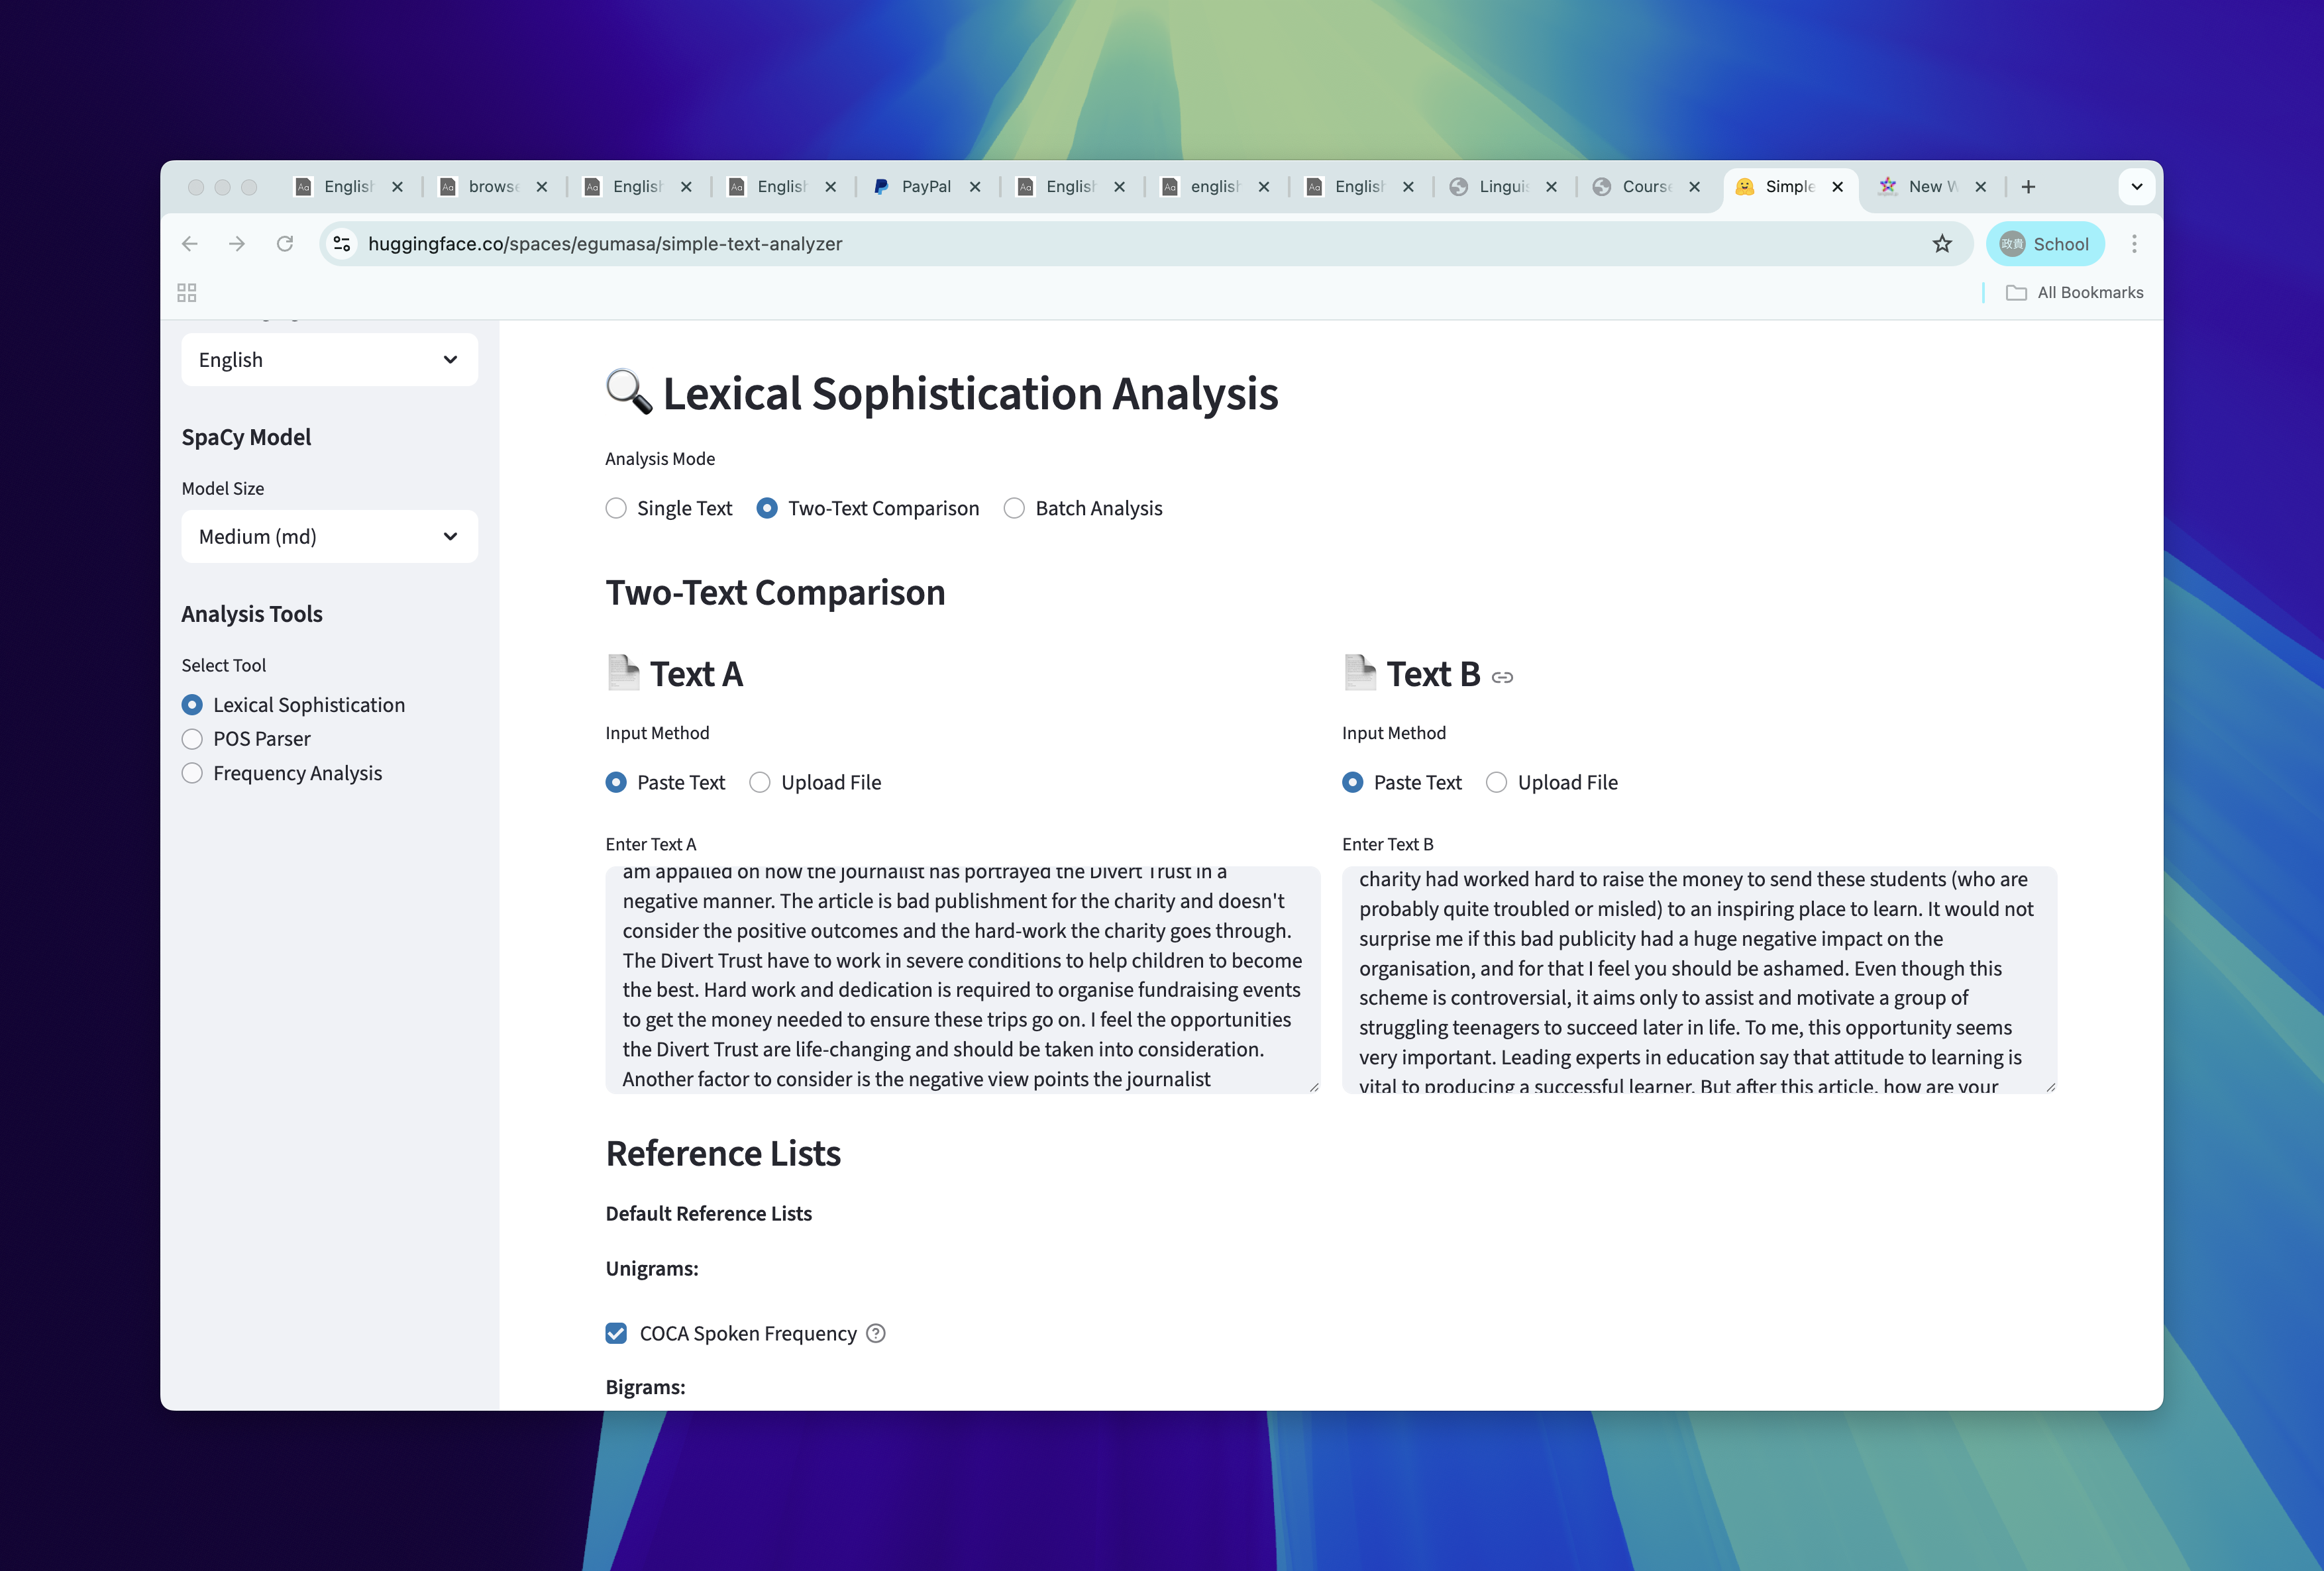
- Let’s use simple text analyzer
Simple Text Analyzer
!
Analyzing single-text in simple text analzer
!
Analyzing single-text in simple text analzer
- Choose single text mode
- Choose
Paste text - Choose Reference list (e.g., COCA Spoken Frequency)
- Choose if you apply log transformation to frequency values
- Hit
Analyze Text
Check impact of log transformation
- How would you explain the results of the log transformation?
- Which one do you recommend?
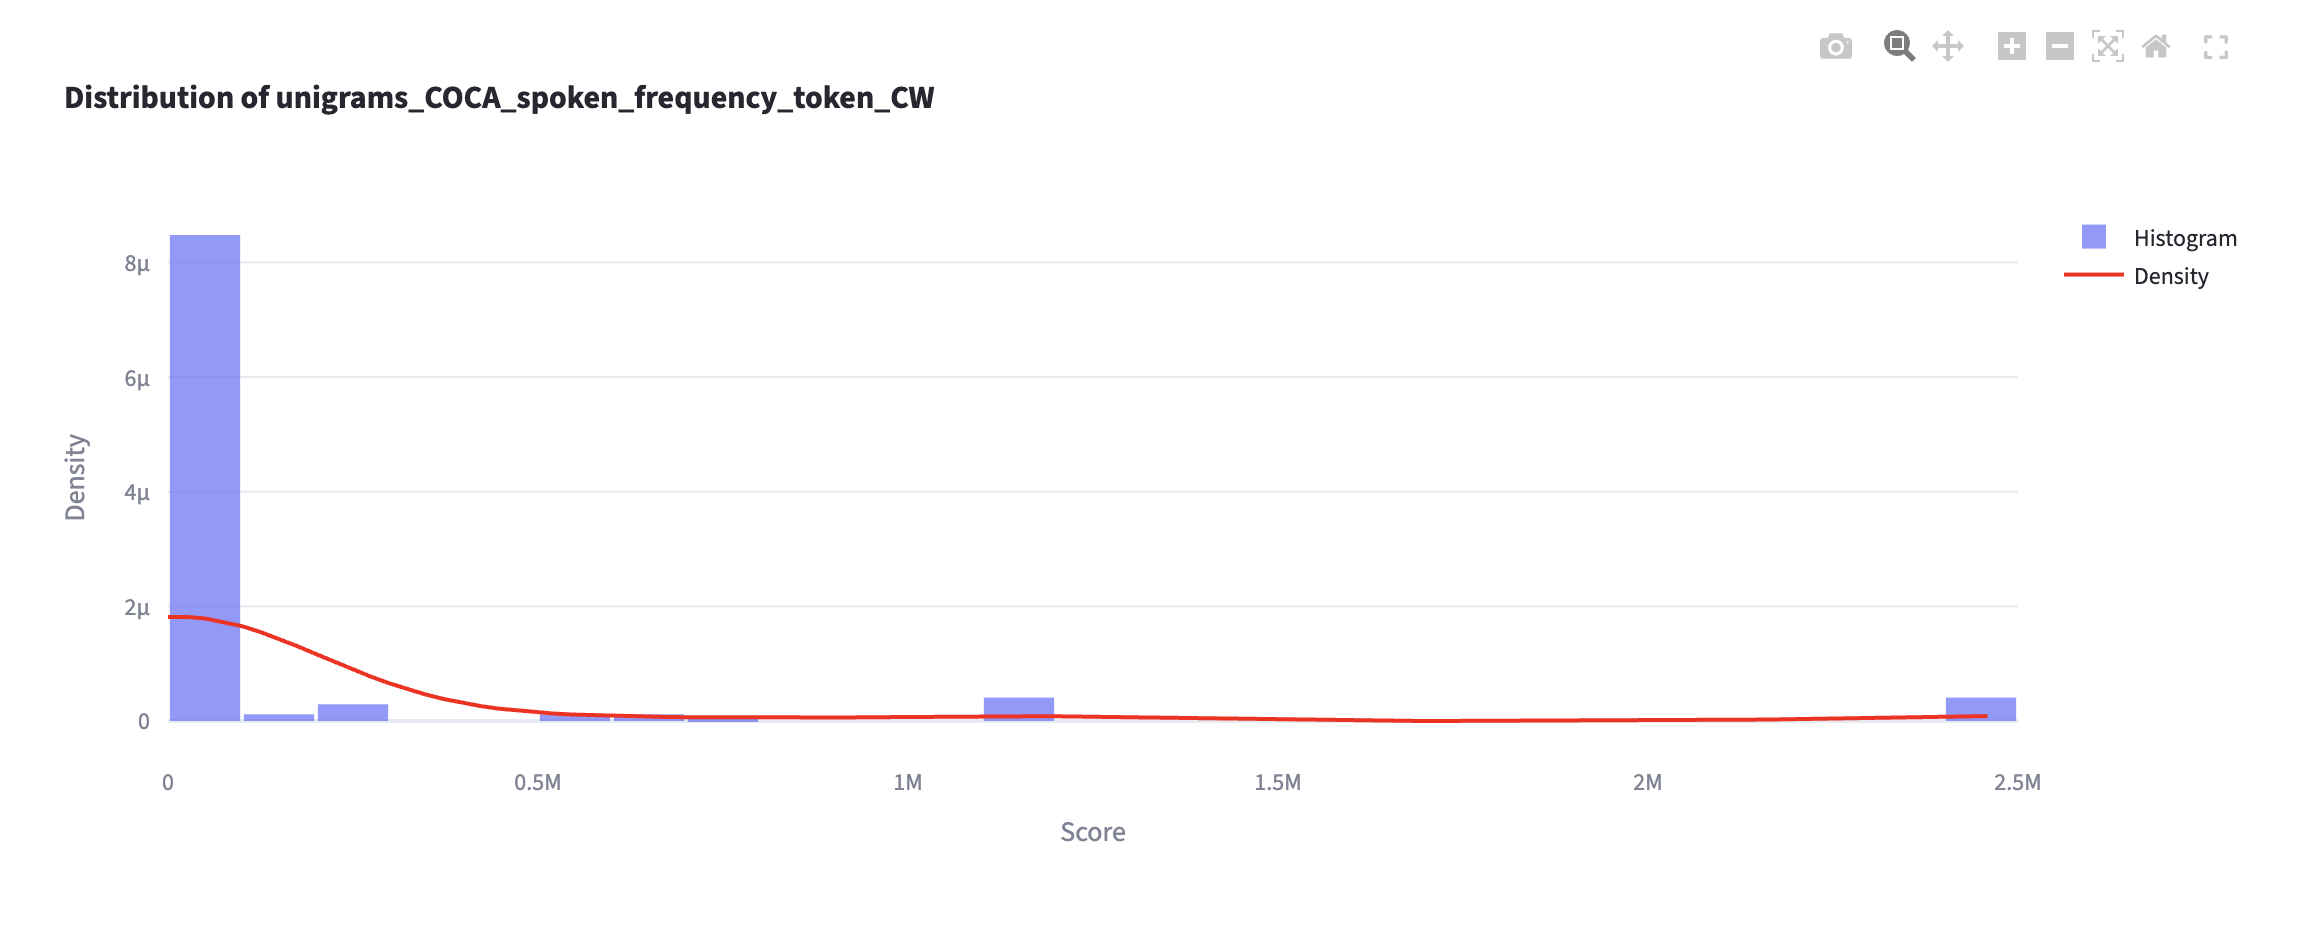

On log transformation
- Log transformation allows the text-internal frequency distribution to approach normal distribution.
- This is generally recommended because the “mean” score behaves well on normally distributed data.
Uploading your frequency list
The simple text analyzer can accept a word frequency list.
Now let’s upload BROWN frequency list.
Corpus Lab 2: Task 3
Comparing lexical characteristics of two texts
Goals
- Compare and contrast two texts along with several lexical diversity metrics
- Observe differences in single-word and multiword sophistication
Data
- Choose two texts from the ICNALE GRA
- If you are unsure, use choose from the following three files:
- GRA_PTJ0_124_ORIG.txt
- GRA_PTJ0_070_ORIG.txt
- GRA_PTJ0_112_ORIG.txt
Step 1: Qualitatively compare two files
- Before we actually obtain lexical sophistication measures, compare two texts in terms of their lexical use.
- In pairs, describe the strengths and weakeness in vocabulary use.
Step 2: Hypothesis
- In what way is one text more lexically sophisticated than the other?
- Try to come up with characteristics that describe the
quality wordsto describe them
- Try to come up with characteristics that describe the
Step 3: Pick two or three lexical sophistication variables
Enter the text into analyzer
We can also compare two texts in simple text analyzer.
!
Pick appropriate lexical sophistication indices
Step 4: Run analyses
Plots that compares two lists
!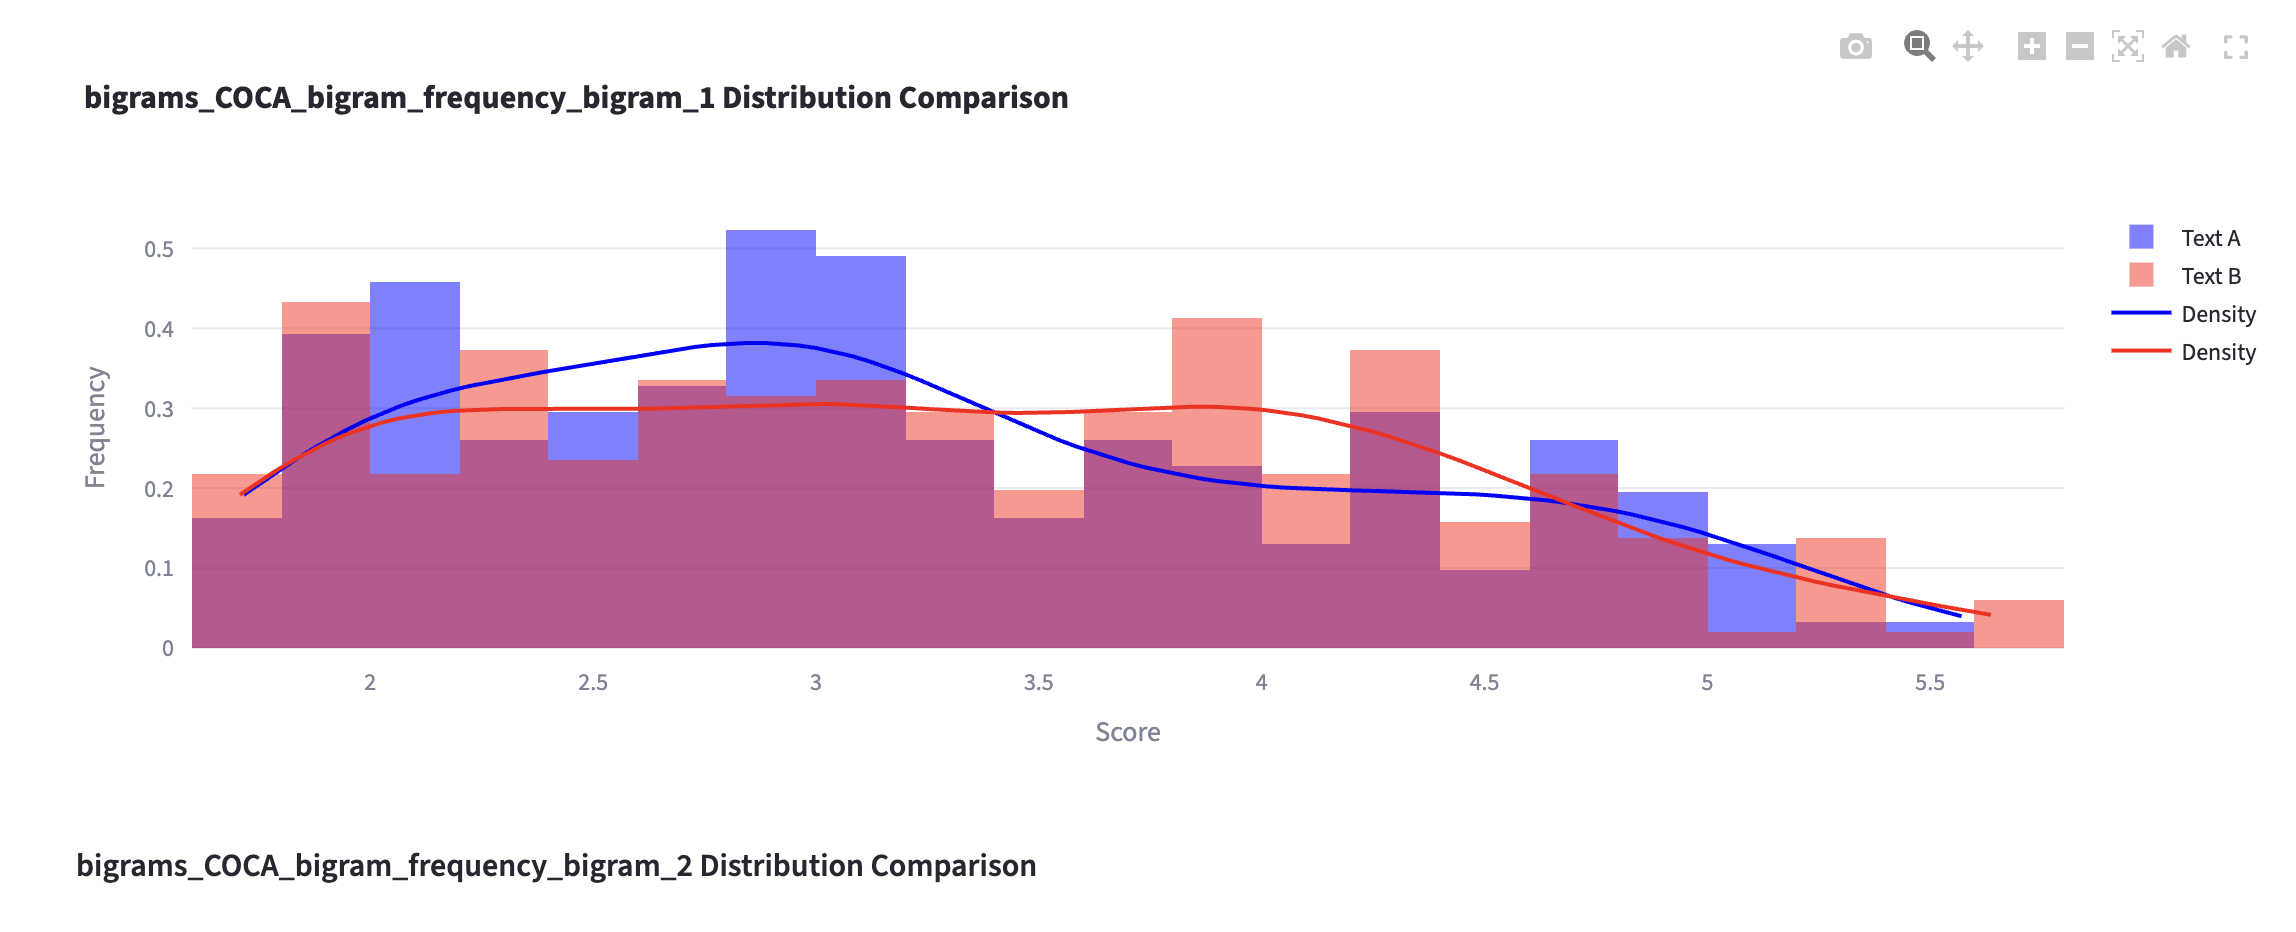
Step 5: Interpret the findings
- Let’s discuss how the two text differ in lexical use from one another.
- Use the tables with token information and visualization to (dis)confirm your hypothesis
Success Criteria
Your submission …
Corpus Lab 2: Submission
- Japanese Word Frequency List and small write-up (5 points)
- Replication of Durrant’s analysis from Figure 4.19 (5 points)
- research question,
- hypothesis,
- plots, and
- results
- Comparison of two texts in terms of lexical sophistication (5 points)
Linguistic Data Analysis I