[1] 0.25Session 8: Hands-on activity #4
About GiG meta data
- GiG metadata documents the necessary data to use for plotting
- Year Group (X-axis in Figure 4.19)
- Genre (grouping variable in Figure 4.19)
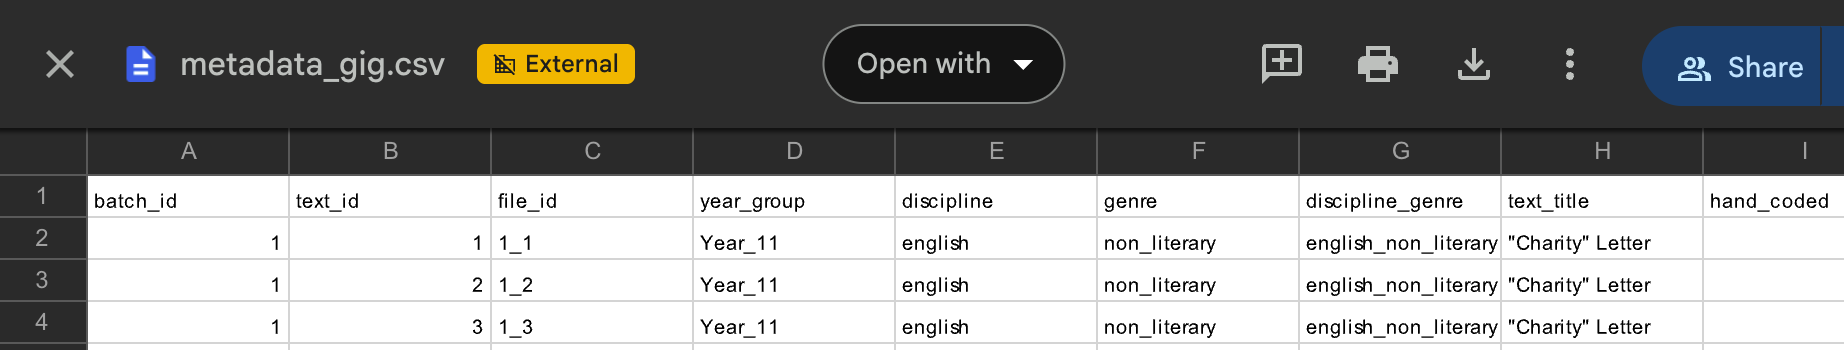
GiG Metadata
Step 3: Pick two or three lexical sophistication variables
Enter the text into analyzer
We can also compare two texts in simple text analyzer.
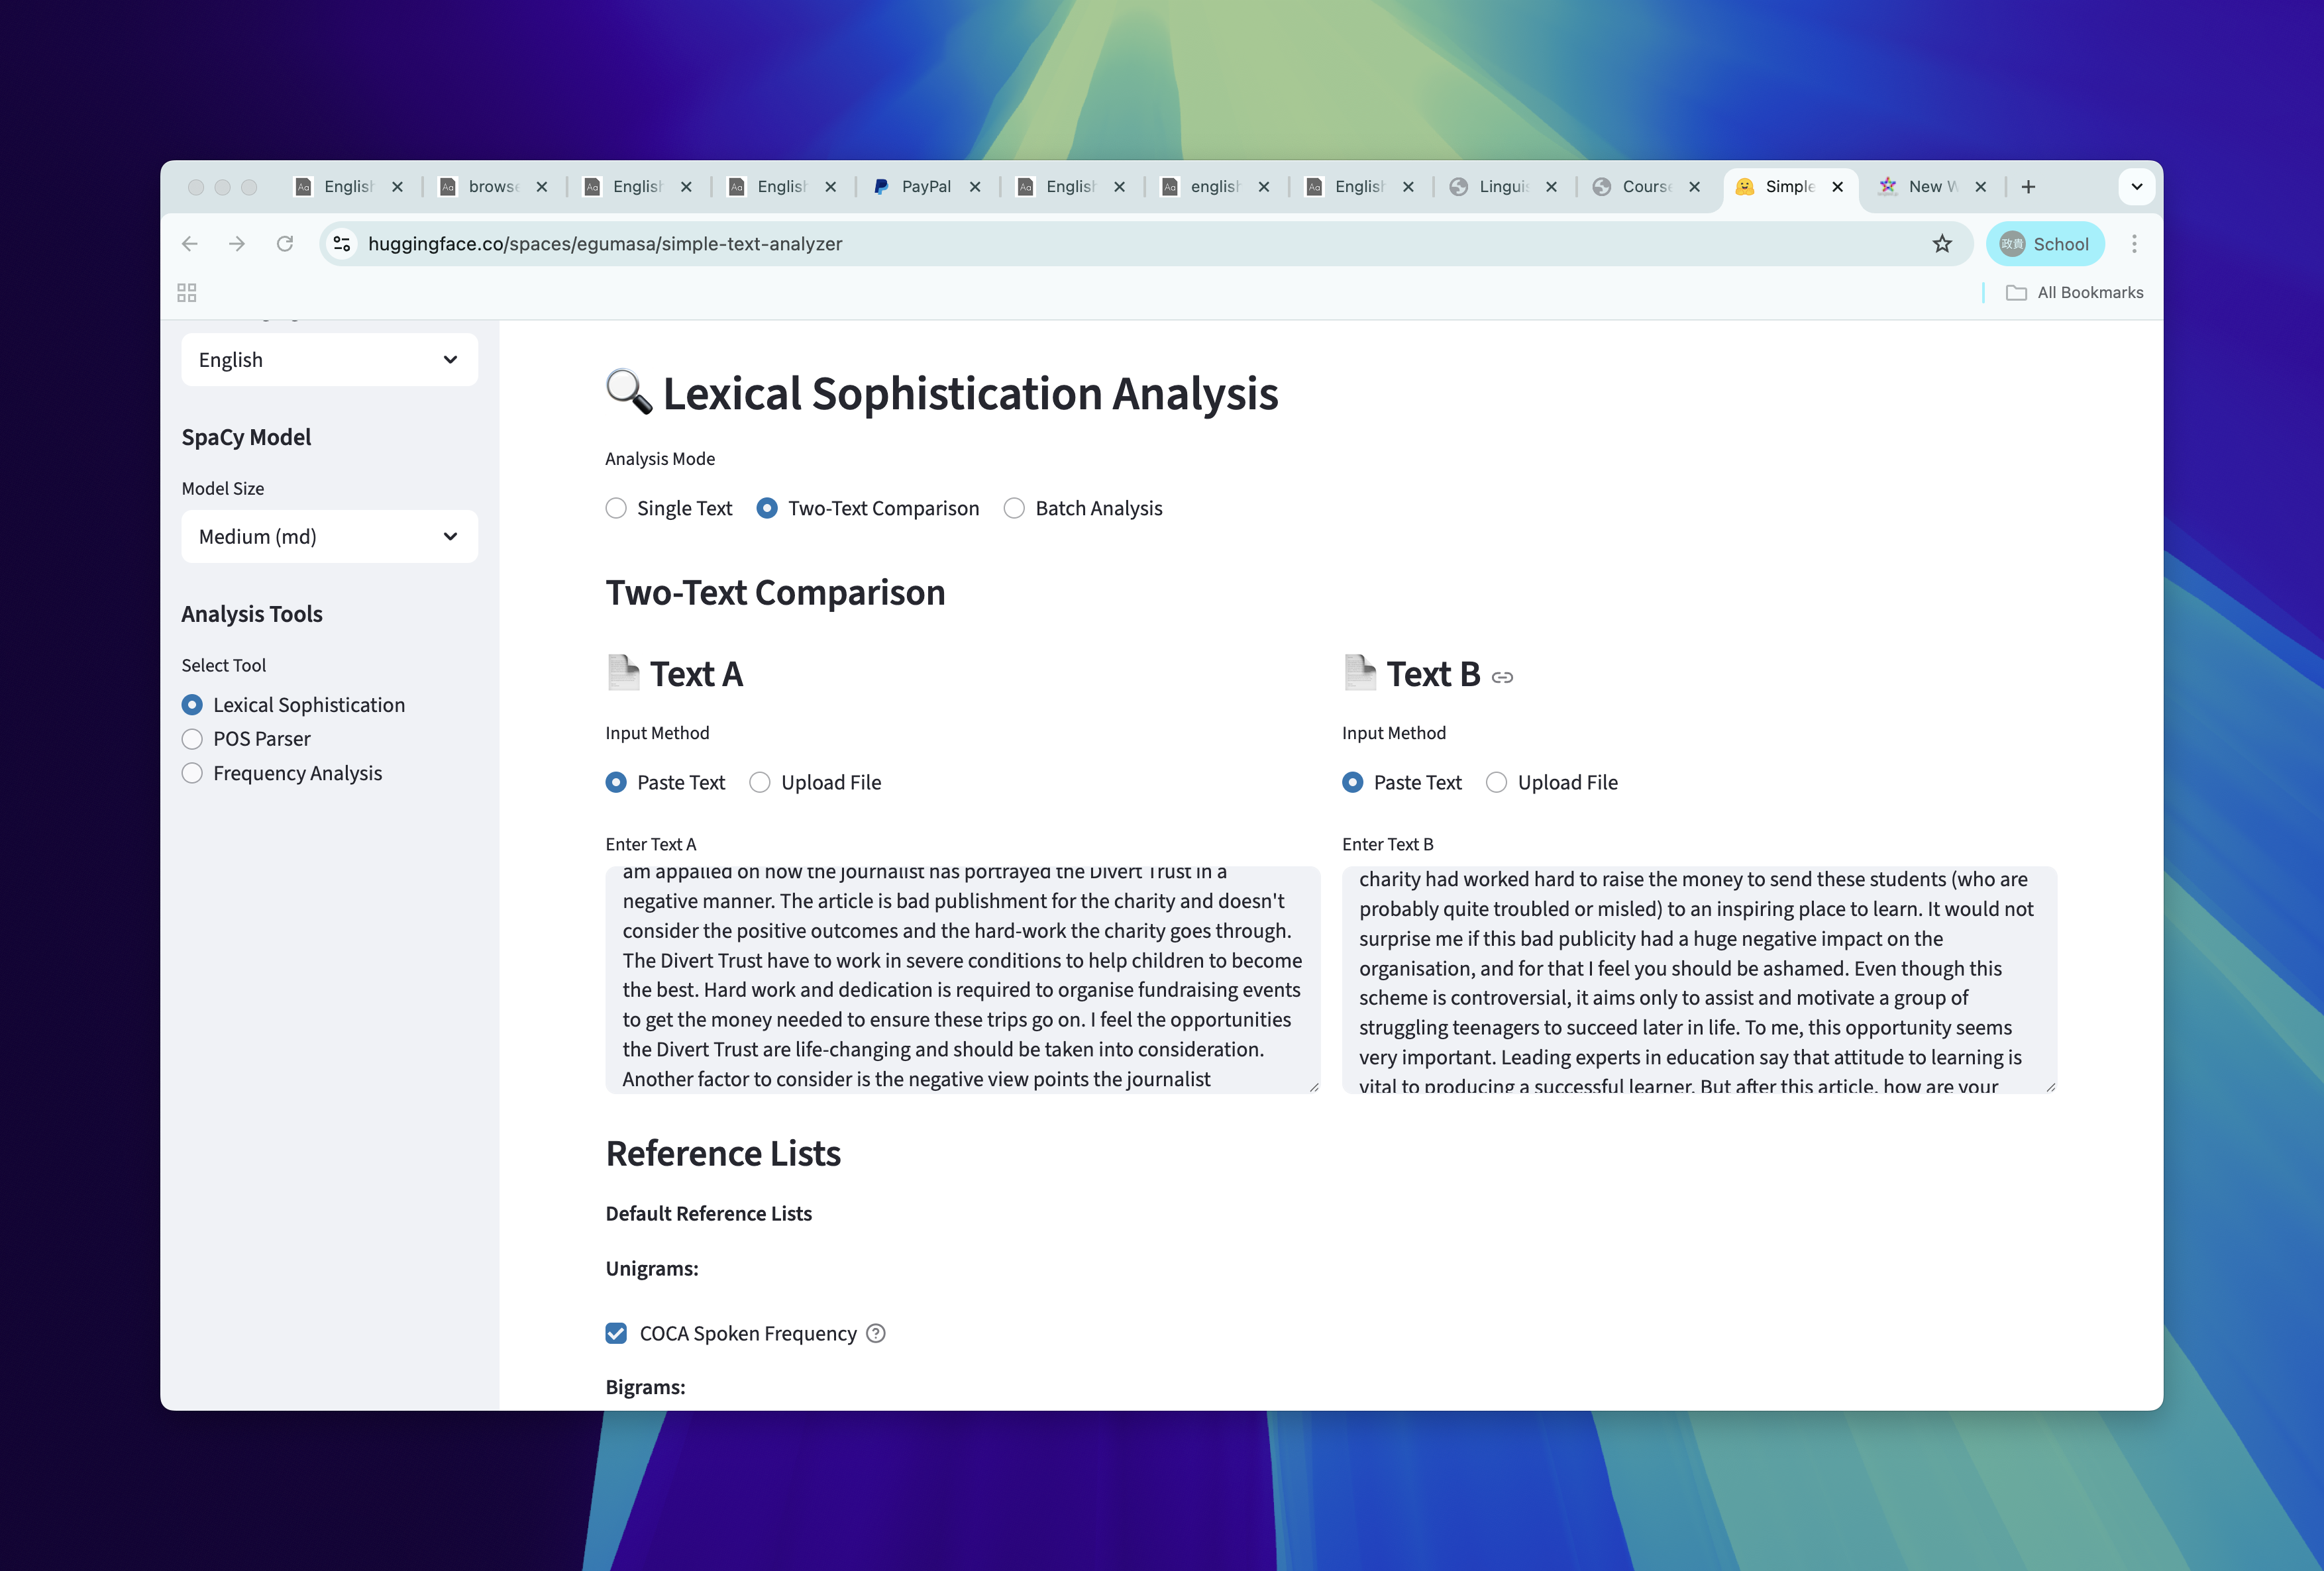
two-text
Step 4: Run analyses
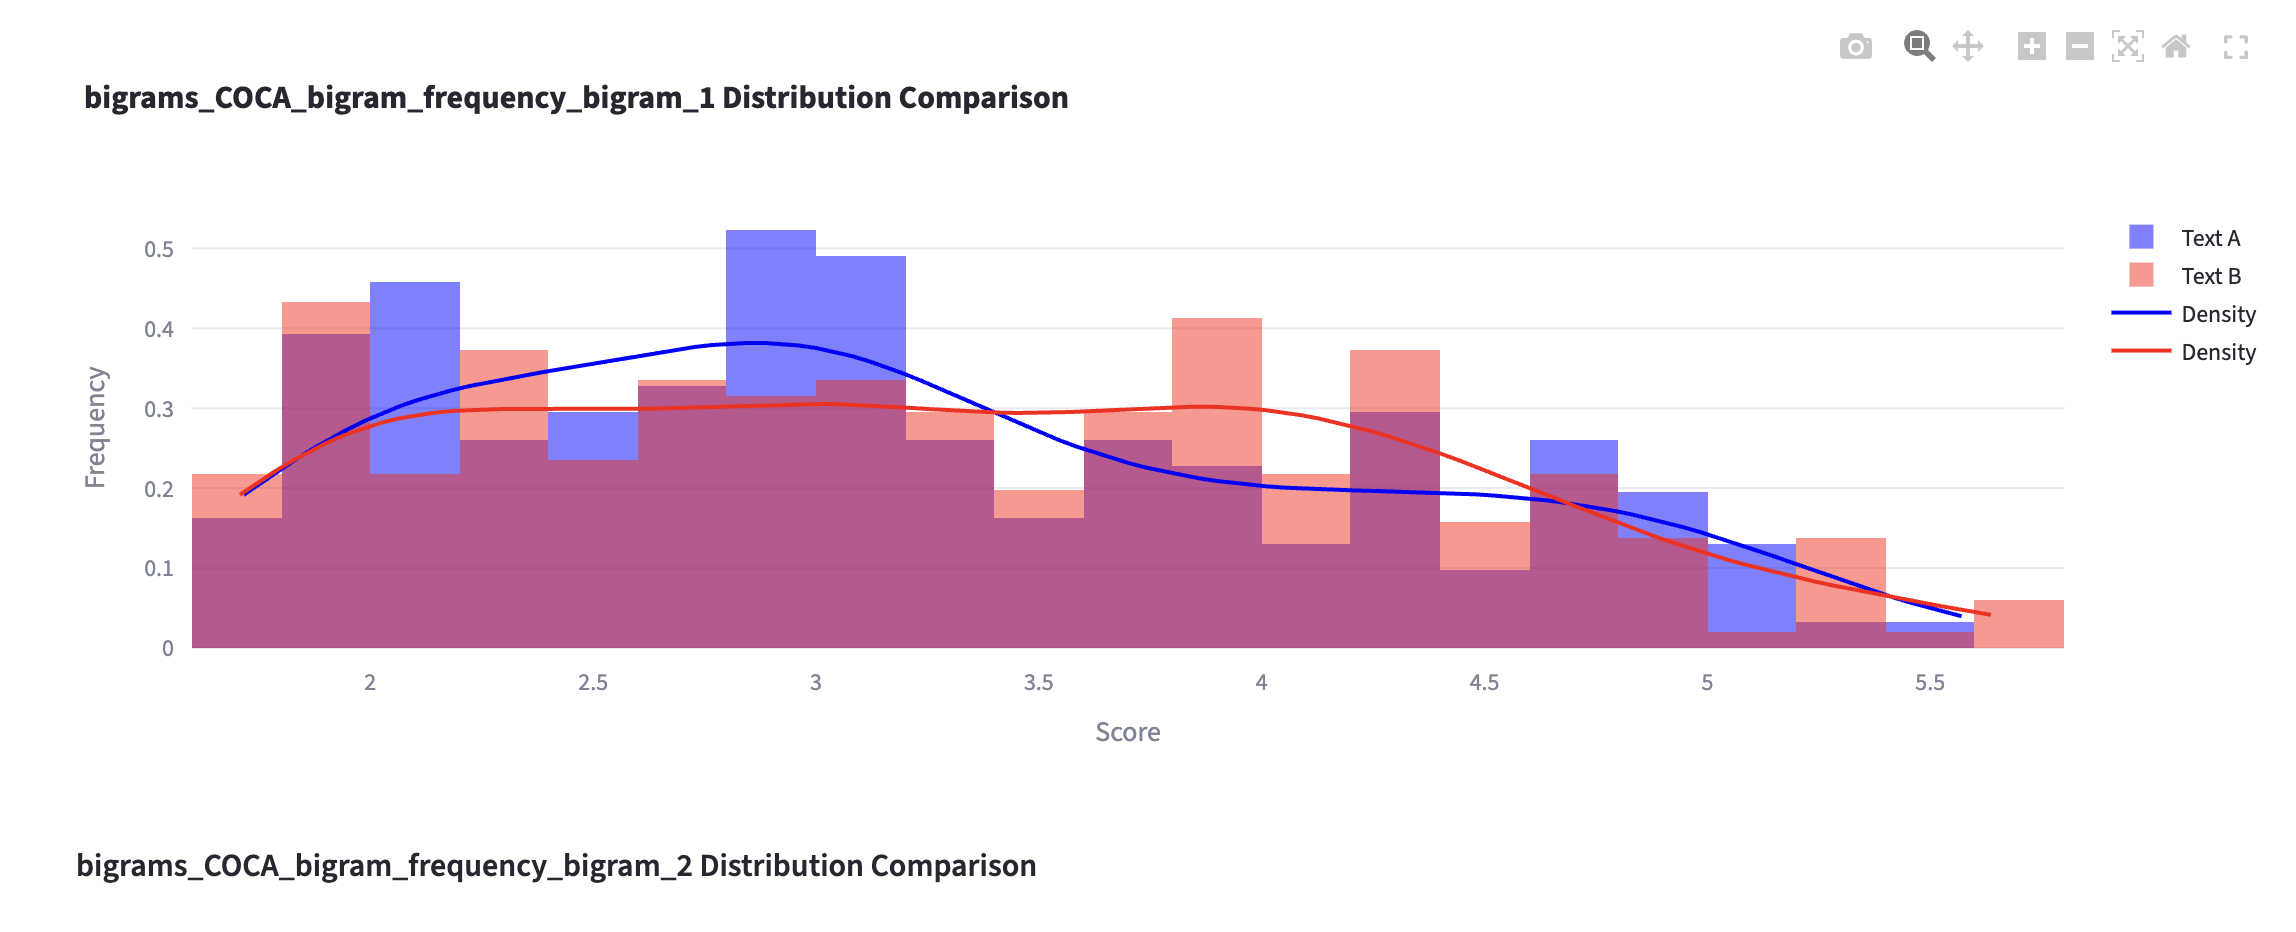
Plots that compares two lists
!
three-word sequences
- You can (a) load corpus, (b) go to N-gram, (c) apply settings, and (d) hit start.
Trigram in BE06
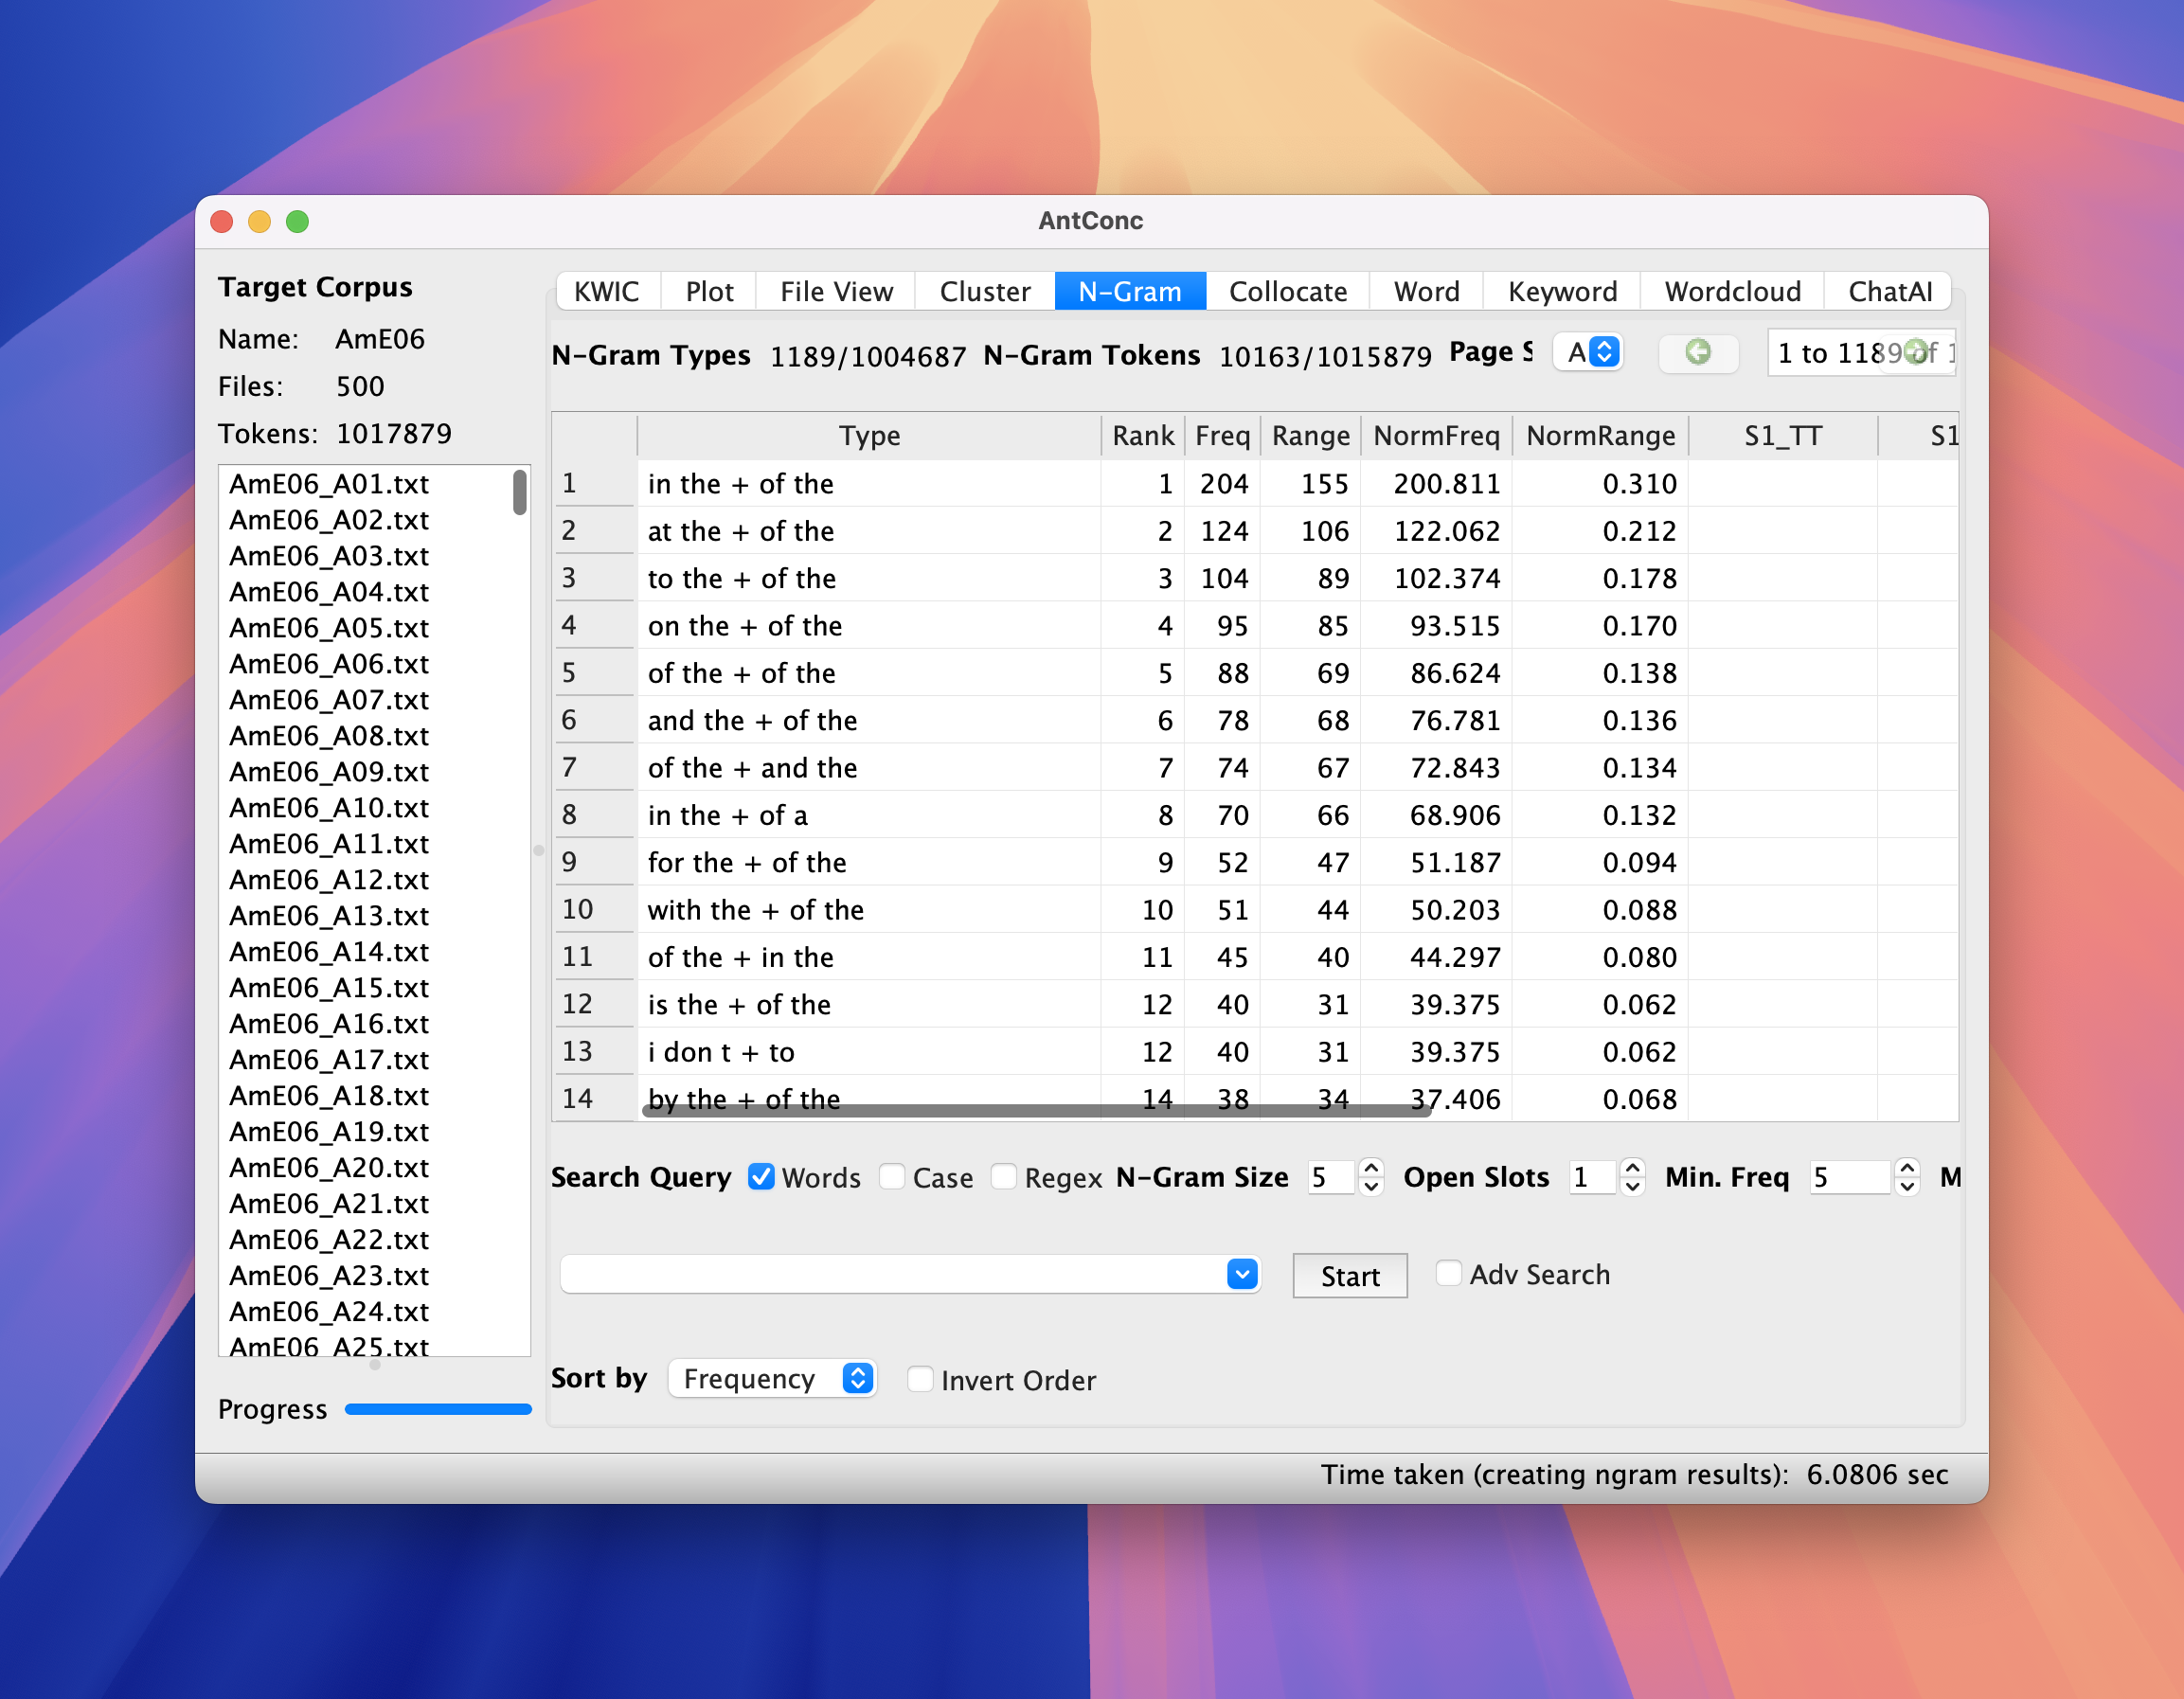
five-word sequences
- Now let’s examine 5 word sequences
Quintgram in BE06
Jumping to KWIC view from the list
In AntConc, we can jump from the item in the list to show KWIC.
KWIC
Generating P-frame list with AntConc
- Let’s now generate p-frame.
- Set openslot to 1. Hit start. What do you see?
P-frames
You should get the following.
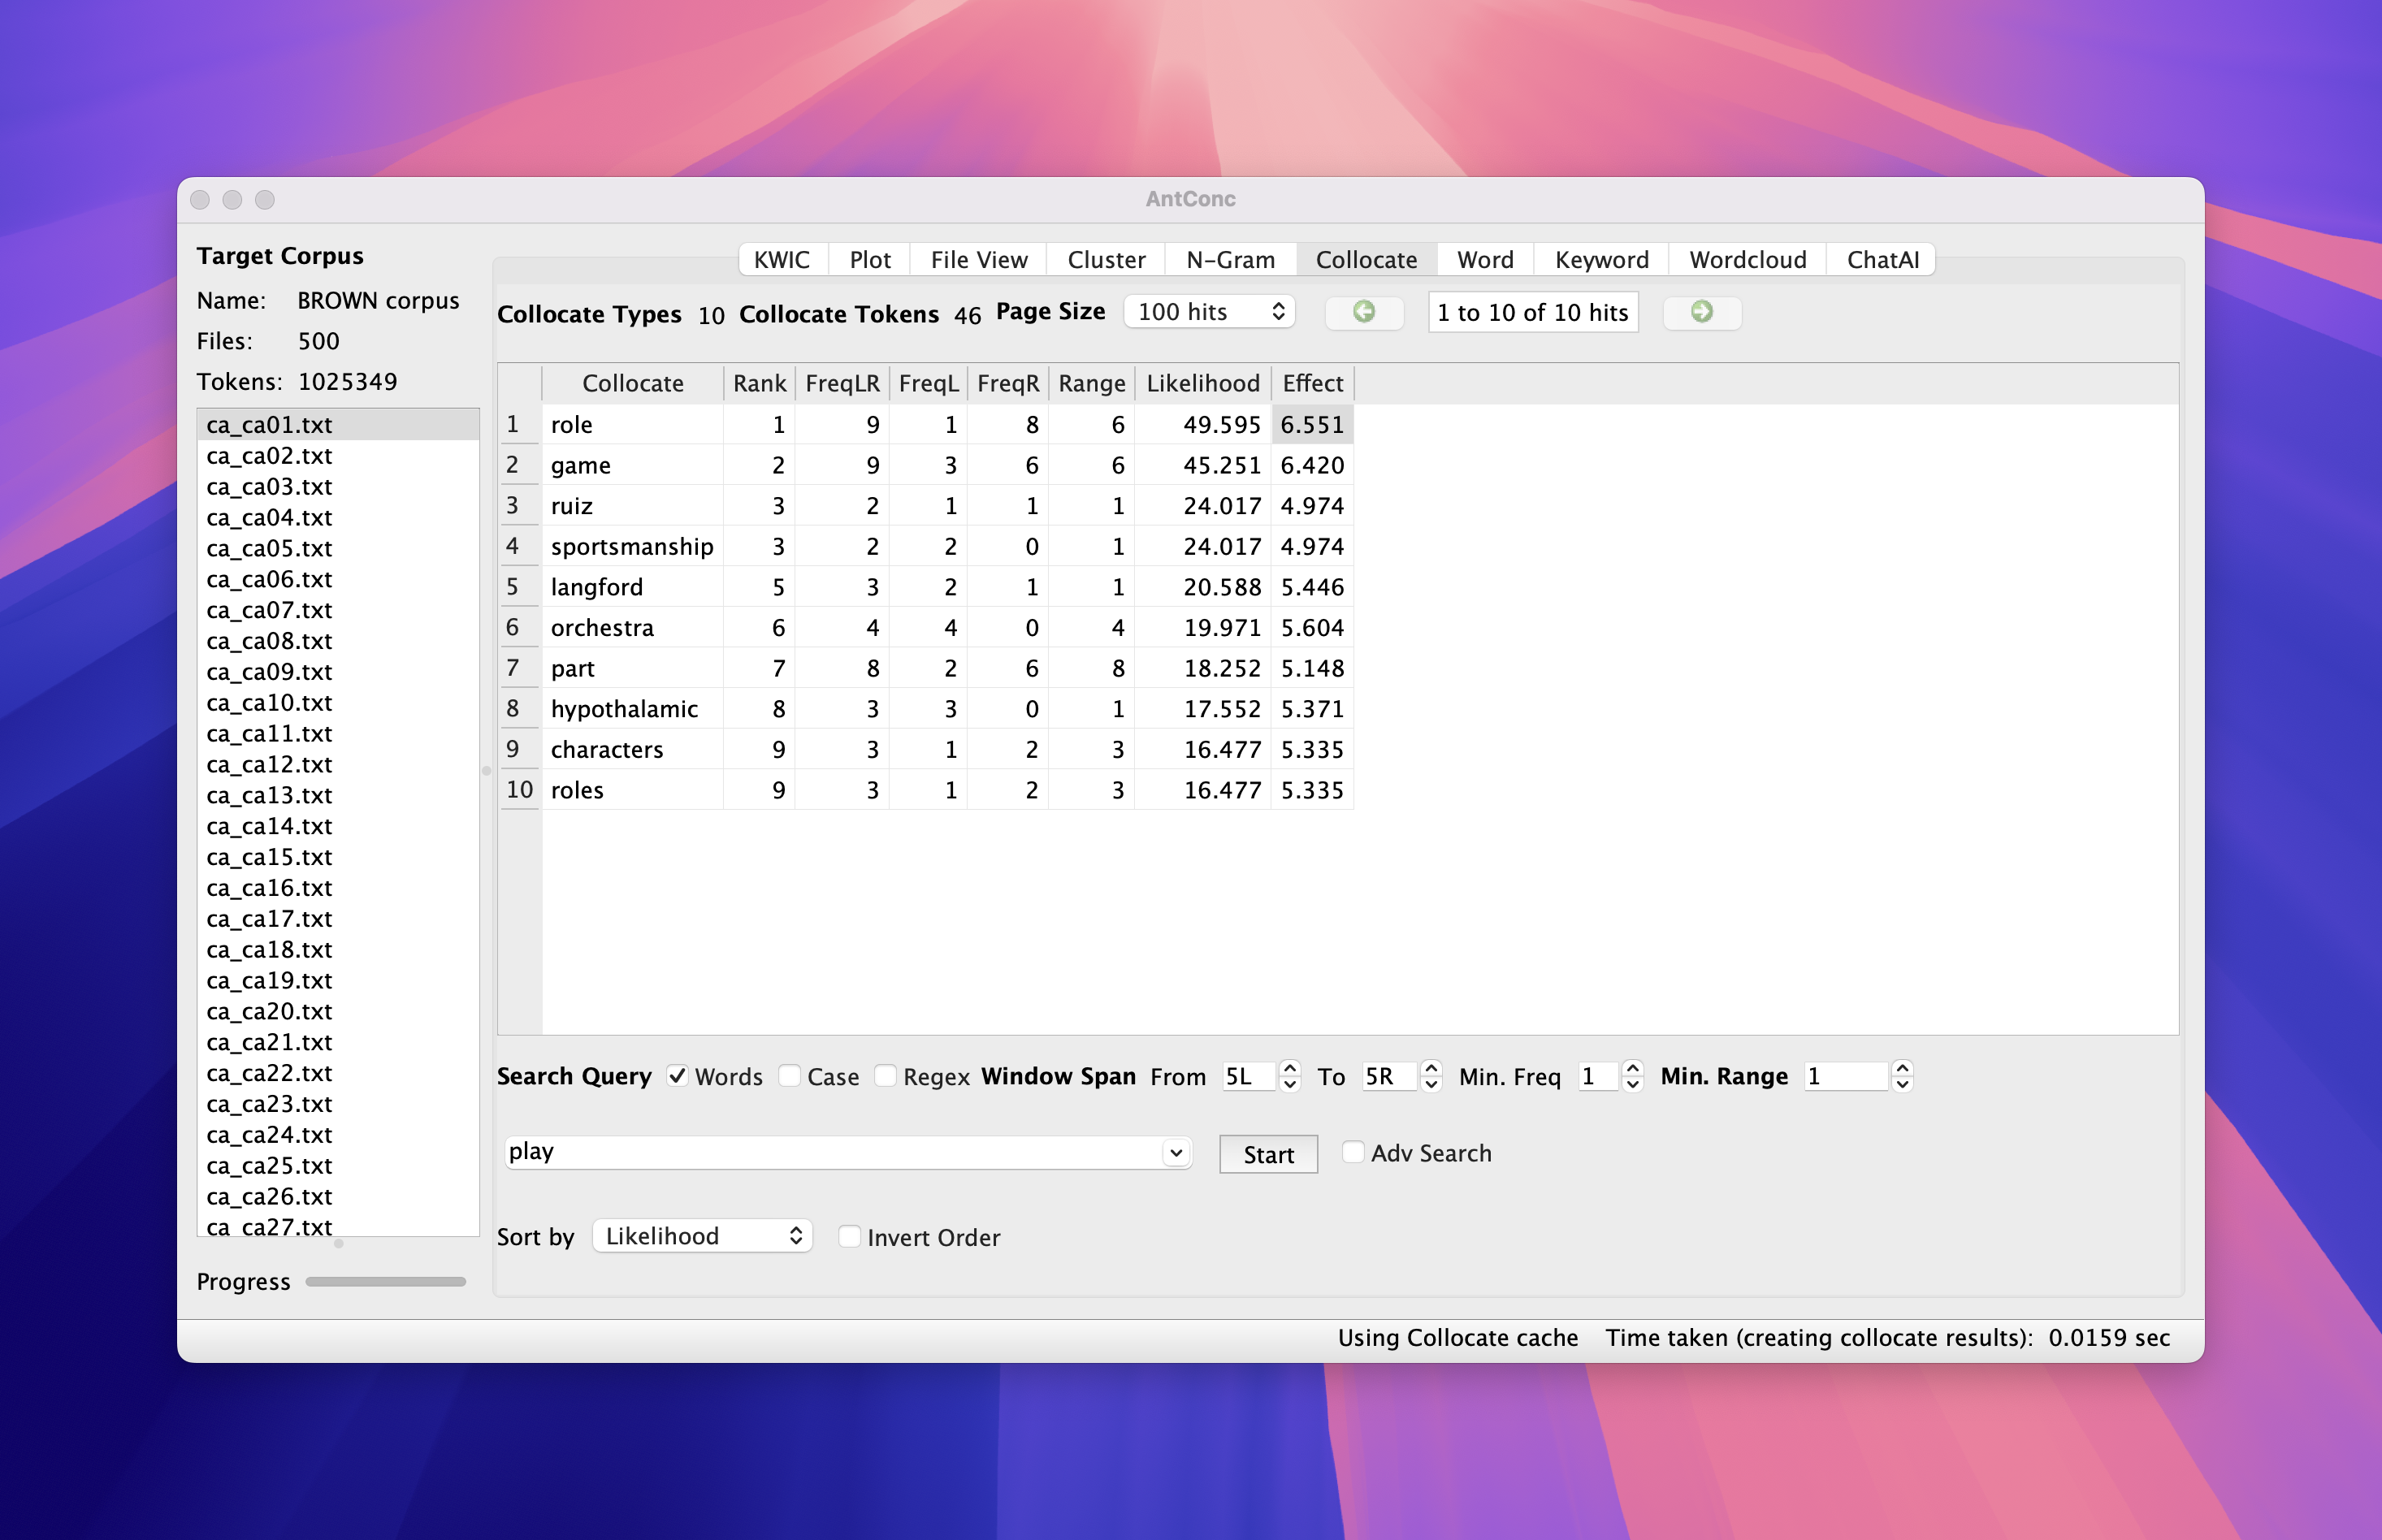
Collocation search in AntConc
Preparation
- Copy and paste word frequency list in
frequencytab
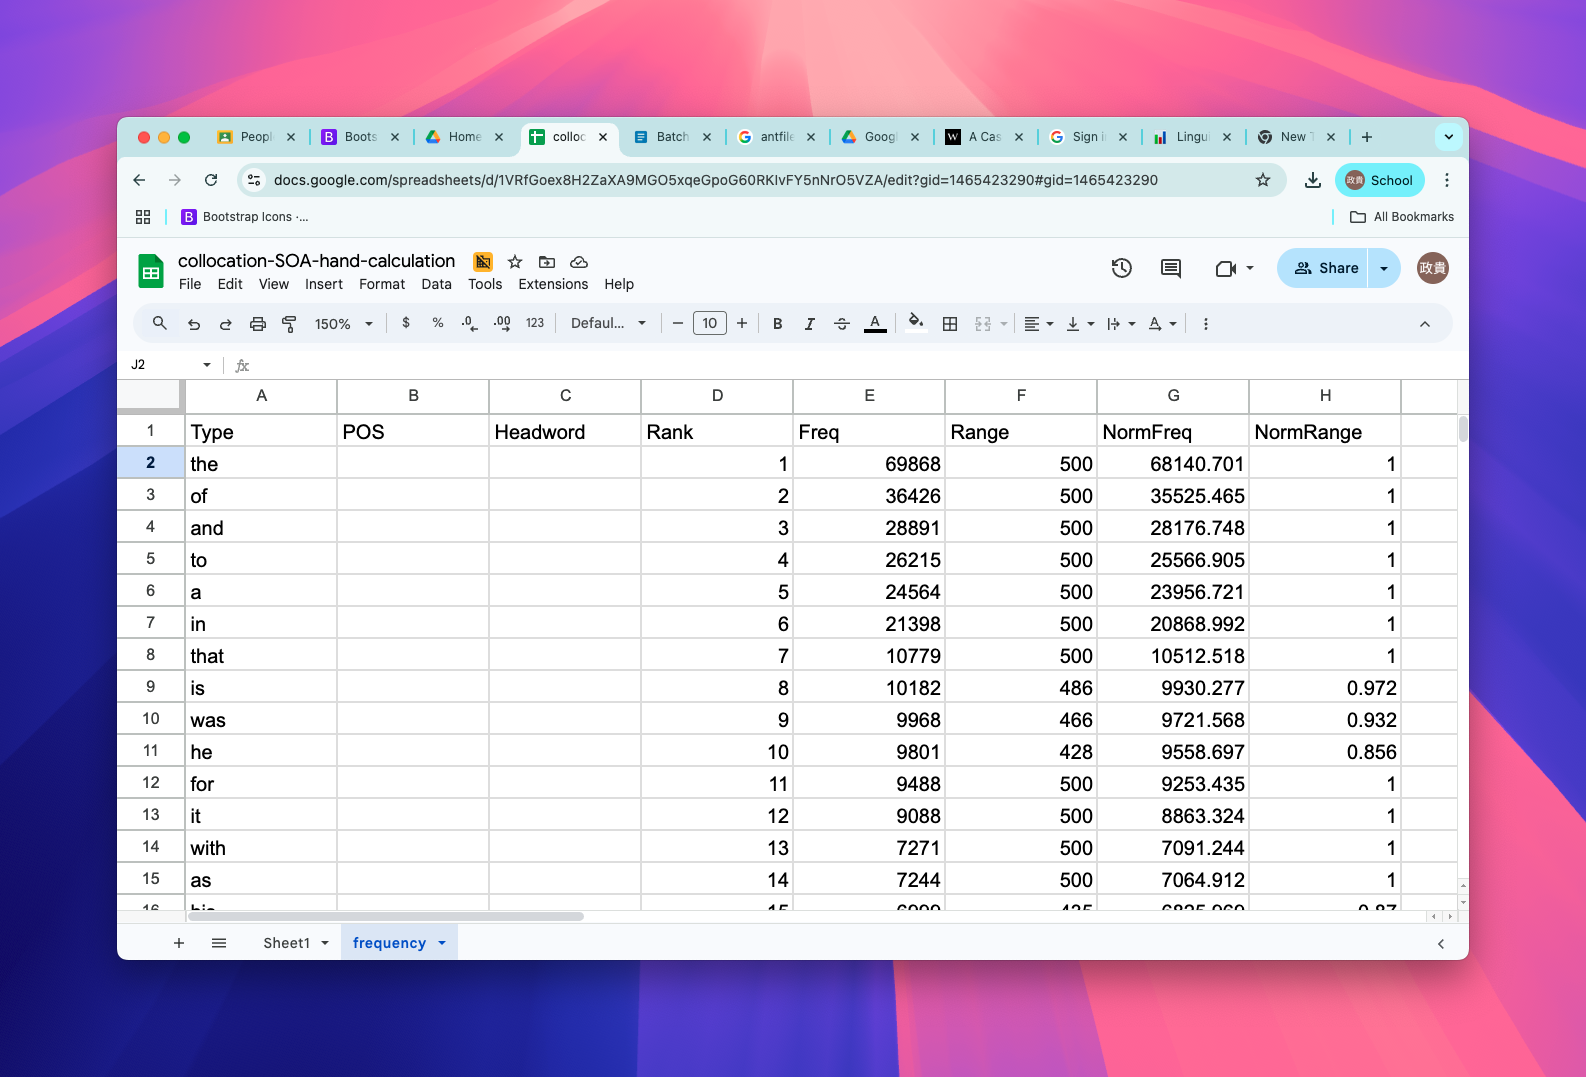
frequency list
Enter the node and collocates
- Now retrieve word frequencies from the frequency list, using function called
vlookup.
retrieve frequency
Collocation frequency (observed)
- Enter node word in search window and look for FreqLR.
Observed frequency
Enter Observed frequency and window size
Enter O11
Expected frequency
- \(E_{11} = {(freq_{node} * freq_{collocate} ) \over Corpus size}\)
expected-frequency
Mutual Information
Finally, we will enter the following formula.
\[MI = {log_2{ Observed freq \over Expected frequency }}\]
Calculating MI
Wait …
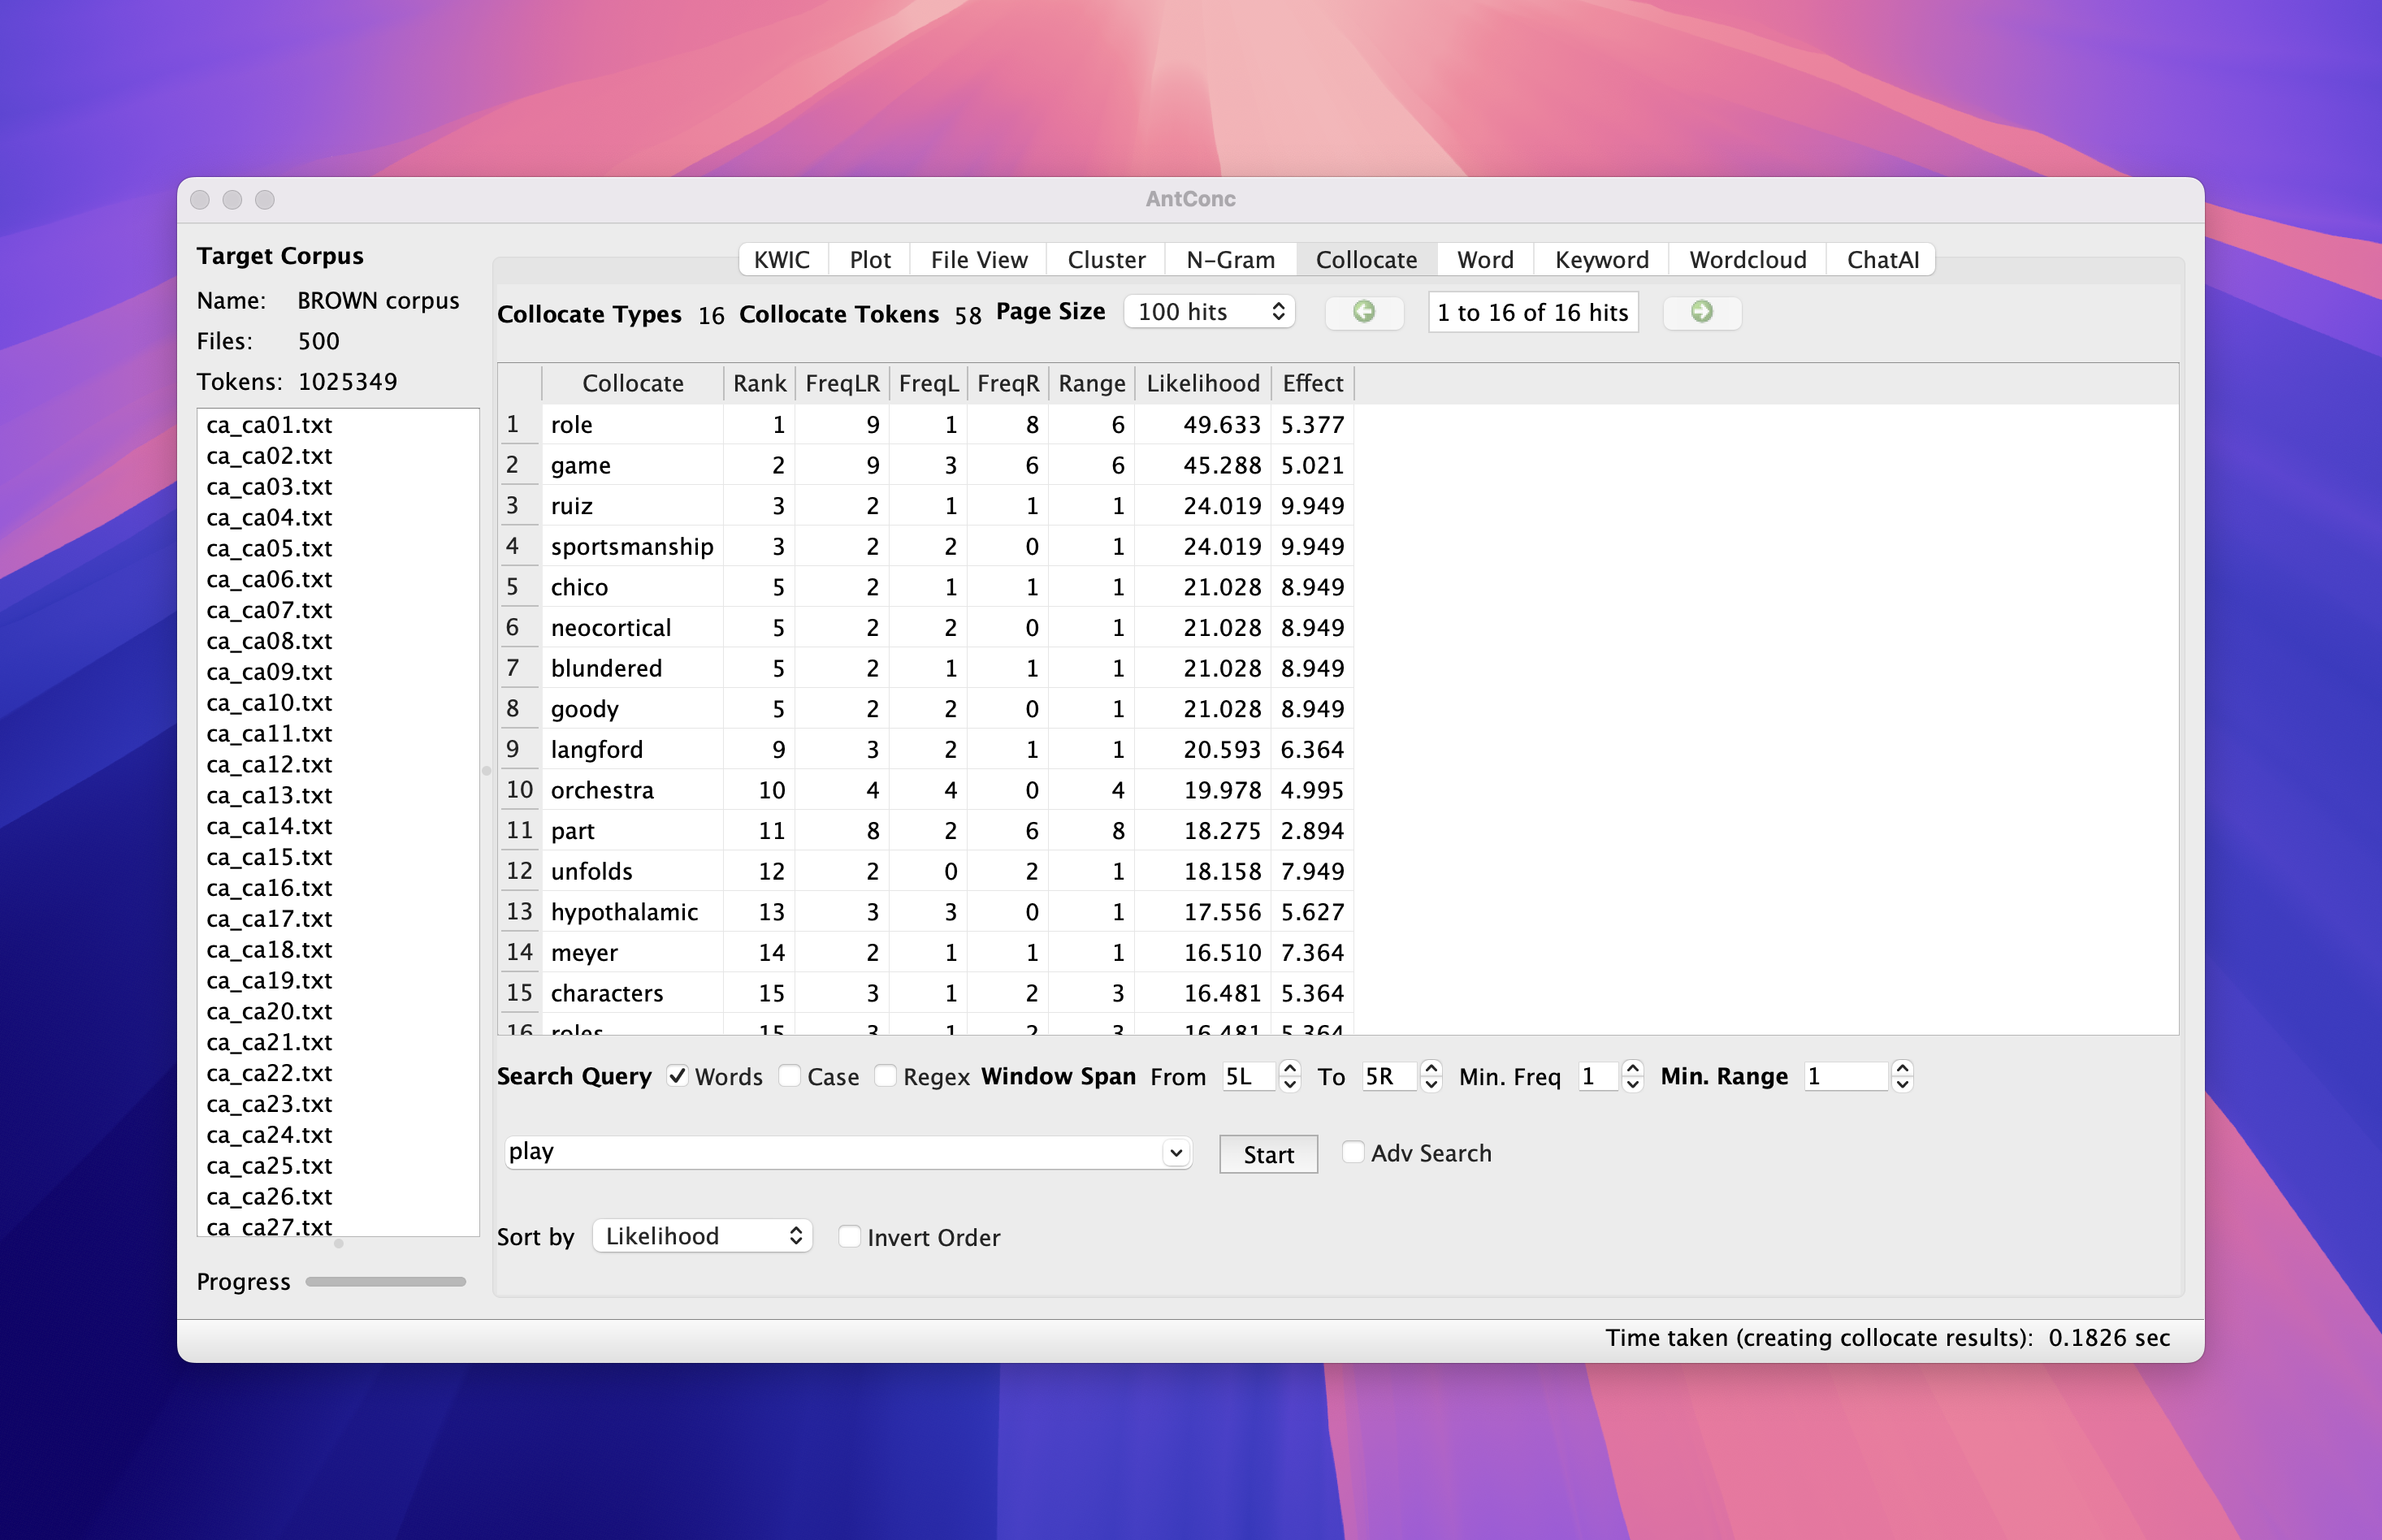
- Our calculation shows that MI = 8.69
- AntConc says 5.377 …
AntConc MI
Okay.. now what?
Let’s fix the expected frequency count.
Fixed expected frequency
- Okay close enough!
Confirming with Casual Conc
- Our score actually is also close to that of Casual Conc
Collocation